Overview
Overview
Source: https://grafana.com/oss/tempo/
Tempo is a high-performance, cost-effective distributed tracing backend. It is deeply integrated with Grafana, Prometheus, Loki, and Mimir. Tempo requires only object storage to operate, making it extremely cheap and simple to maintain.
Key Features
| Feature | Description | Status in Our Setup |
|---|---|---|
| Distributed Tracing | Storing and querying traces from any application | ✅ Configured |
| TraceQL | Query language for traces (similar to SQL) | ✅ Configured |
| Metrics Generator | Generating metrics from traces (RED metrics, service graphs) | ✅ Configured |
| Traces to Metrics | Linking traces with metrics in Grafana | ✅ Configured |
| Traces to Logs | Linking traces with logs (Loki) in Grafana | ✅ Configured |
| Traces to Profiles | Linking traces with profiles (Pyroscope) in Grafana | ✅ Configured |
| Service Graphs | Automatic visualization of service dependencies | ✅ Configured |
| TraceQL Metrics (Drilldown) | Real-time metrics from TraceQL queries | ✅ Configured |
| Multi-protocol Ingestion | OTLP, Jaeger, Zipkin, OpenCensus | ✅ Configured |
| MCP Server | Model Context Protocol server for AI assistants | ✅ Configured |
Deployment Modes
- Monolithic mode
- All components in a single process
- Good for: local development, small workloads (~20GB traces/day)
- Can scale horizontally via gossip ring
- Simple Scalable (default)
- Separates read and write paths
- Good for: up to a few TB/day
- Microservices mode (our setup)
- Each component deployed separately
- Best for: production, high availability, large scale
- Full control over scaling each component
Components
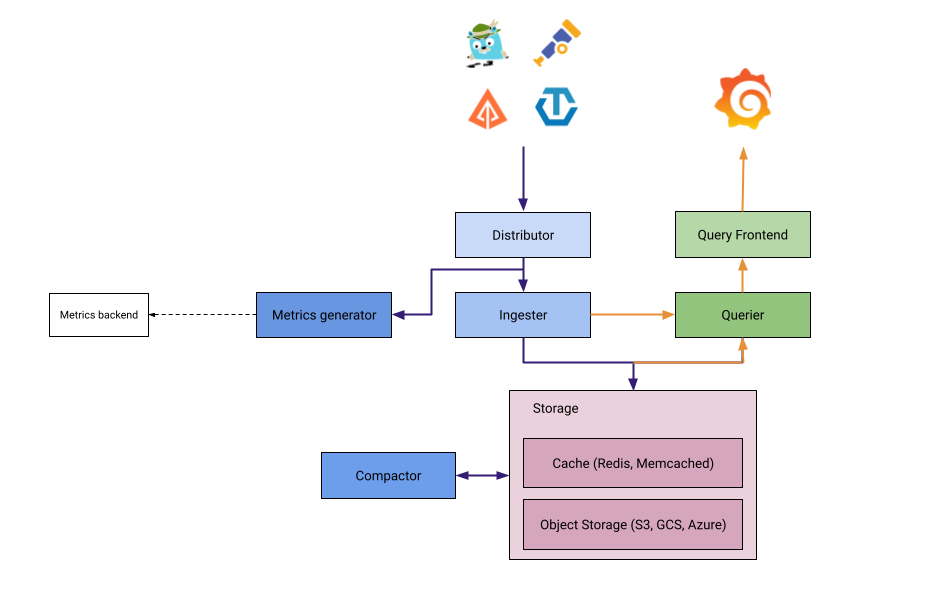
Distributor
- Entry point for trace ingestion — accepts spans in multiple formats (OTLP, Jaeger, Zipkin, OpenCensus)
- Under the hood, uses the receiver layer from the OpenTelemetry Collector framework
- Routes spans to Ingesters by hashing the
traceIDand using a distributed consistent hash ring - The recommended format is OTel Proto (OTLP) for performance — this is why Grafana Alloy uses the OTLP exporter/receiver to send spans to Tempo
- Stateless — can be scaled independently
Ingester
- Receives spans from the Distributor and partitions span/resource attributes into the Parquet schema for efficient reads
- Groups traces into blocks over a configured time period or until the maximum block size is reached
- Generates bloom filters and indexes for each block, then flushes everything to backend object storage
- Block structure in storage:
<bucketname>/<tenantID>/<blockID>/meta.json /index /data /bloom_0 ... bloom_n - In scaled deployments, creates redundancy mechanisms (not available in monolithic mode)
- Participates in the gossip ring for cluster state synchronization
- Hosts Metrics Generator processors
Query Frontend
- Main query interface — handles trace lookup by ID (
GET /api/traces/<traceID>) and filtering via TraceQL - Shards the search space — splits the blockID space into configurable shards
- Distributes sharded requests across one or more Queriers in parallel to speed up responses
- Merges span data returned from multiple Queriers into a single coherent response
- Provides query queuing, retry, and optional caching
- When the trace limit is reached — returns results collected so far and cancels remaining requests to Queriers
Querier
- Performs the actual data search across blocks to find matching spans
- Queries Ingesters for recently received traces (not yet flushed to storage)
- Fetches bloom filters and indexes from backend storage to efficiently locate traces in object storage blocks
- This dual-source approach ensures access to both fresh and historical data
- Queries should always go through the Query Frontend, not directly to the Querier
- More Queriers = faster query responses
Compactor
- Runs at scheduled intervals — compresses, deduplicates, and reorganizes blocks written by Ingesters
- Takes into account data within specific traces to minimize future search space
- Enforces retention policies — removes data after the configured time-to-live expires
- Reduces storage costs and improves query performance
- Gradually being replaced by the Scheduler/Worker architecture (see below)
Scheduler & Worker (new architecture)
- Designed to eventually replace the Compactor with a more deterministic approach and less duplication
- Scheduler: responsible for planning and tracking tasks assigned to Workers. Only one scheduler should run at a time
- Worker: connects to the Scheduler via gRPC, receives and executes assigned tasks (currently compaction and retention), reports status back
- Workers maintain the block list for all tenants (previously the Compactor’s responsibility) and coordinate tenant querying through the ring
- Migration: scale Workers up while scaling the Compactor down to zero to avoid conflicts
Metrics Generator
- Optional component that generates metrics from trace data
- Processors:
- span-metrics: RED metrics (Rate, Errors, Duration) per service/operation
- service-graphs: service dependencies
- local-blocks: TraceQL metrics for the Drilldown view
- Sends generated metrics to a remote write endpoint (Mimir/Prometheus)
Gateway
- Reverse proxy (Nginx)
- Routes HTTP/gRPC traffic to the appropriate components
- Single entry point for external access
Auto-Scaling Best Practices
In microservices mode, Tempo components can be independently auto-scaled with Kubernetes HPA. The architecture cleanly separates write-path and read-path components.
Which Components to Auto-Scale
| Component | Auto-scalable? | Scale trigger | Notes |
|---|---|---|---|
| Distributor | ✅ Yes | CPU, incoming span rate | Stateless — safe to scale freely |
| Ingester | ⚠️ With care | Memory, active traces | Stateful — participates in hash ring, holds data in memory before flushing |
| Query Frontend | ⚠️ Rarely needed | — | 2 replicas usually sufficient — it shards queries, doesn’t execute them |
| Querier | ✅ Yes | CPU, query queue depth | Stateless — more queriers = faster queries |
| Compactor | ❌ No | — | Singleton or small fixed count |
| Metrics Generator | ⚠️ With care | CPU, memory | Stateful (ring member), but lighter state than ingesters |
HPA Examples
Distributor — scale on CPU:
apiVersion: autoscaling/v2
kind: HorizontalPodAutoscaler
metadata:
  name: tempo-distributor
spec:
  scaleTargetRef:
    apiVersion: apps/v1
    kind: Deployment
    name: tempo-distributor
  minReplicas: 2
  maxReplicas: 10
  metrics:
    - type: Resource
      resource:
        name: cpu
        target:
          type: Utilization
          averageUtilization: 70
Querier — scale on CPU:
apiVersion: autoscaling/v2
kind: HorizontalPodAutoscaler
metadata:
  name: tempo-querier
spec:
  scaleTargetRef:
    apiVersion: apps/v1
    kind: Deployment
    name: tempo-querier
  minReplicas: 2
  maxReplicas: 10
  metrics:
    - type: Resource
      resource:
        name: cpu
        target:
          type: Utilization
          averageUtilization: 65
Ingester Scaling — Special Considerations
Ingesters are stateful — they hold trace data in memory and flush blocks to object storage. The same principles as Loki ingesters apply:
- Scale-up: new ingester joins the ring, receives new trace ID ranges via consistent hashing
- Scale-down: ingester must flush all blocks before shutdown
- Set
terminationGracePeriodSecondshigh enough (e.g., 300s) - Use
/ingester/shutdownendpoint orpreStophook - Scale down one at a time — wait for ring rebalancing between removals
- Set
terminationGracePeriodSeconds: 300
lifecycle:
  preStop:
    httpGet:
      path: /ingester/shutdown
      port: http-metrics
Key Metrics for Auto-Scaling
# Distributor — incoming spans/sec
rate(tempo_distributor_spans_received_total[5m])

# Ingester — memory pressure
tempo_ingester_live_traces

# Querier — active queries
tempo_querier_inflight_search_requests

# Compactor — block count (for capacity monitoring, not auto-scaling)
tempo_compactor_outstanding_blocks
General Guidelines
- Write path scales independently from read path — trace ingestion spikes don’t correlate with query load
- Distributors are the easiest win — stateless, scale aggressively on CPU
- Queriers are the second priority — more queriers = lower search latency
- Ingesters need PodDisruptionBudget (
maxUnavailable: 1) to prevent data loss during rolling updates - Set
minReplicas≥ 2 for all components except compactor - Monitor ring health after scaling:
tempo_ring_members— if ring is unstable, pause auto-scaling