Traces
🔍 Introduction
What are they for?
Detail arranged in the context of the entire flow
🧭 What are traces?
Traces are request flow trails through a distributed system that show the complete execution path from start to finish.
📍 Basic Concepts
🔗 Trace
Complete flow of a single request through all services
📦 Span
A single operation within a trace (e.g., HTTP call, database query)
🌳 Parent-Child Relationship
Spans form a hierarchy - parent span contains child spans
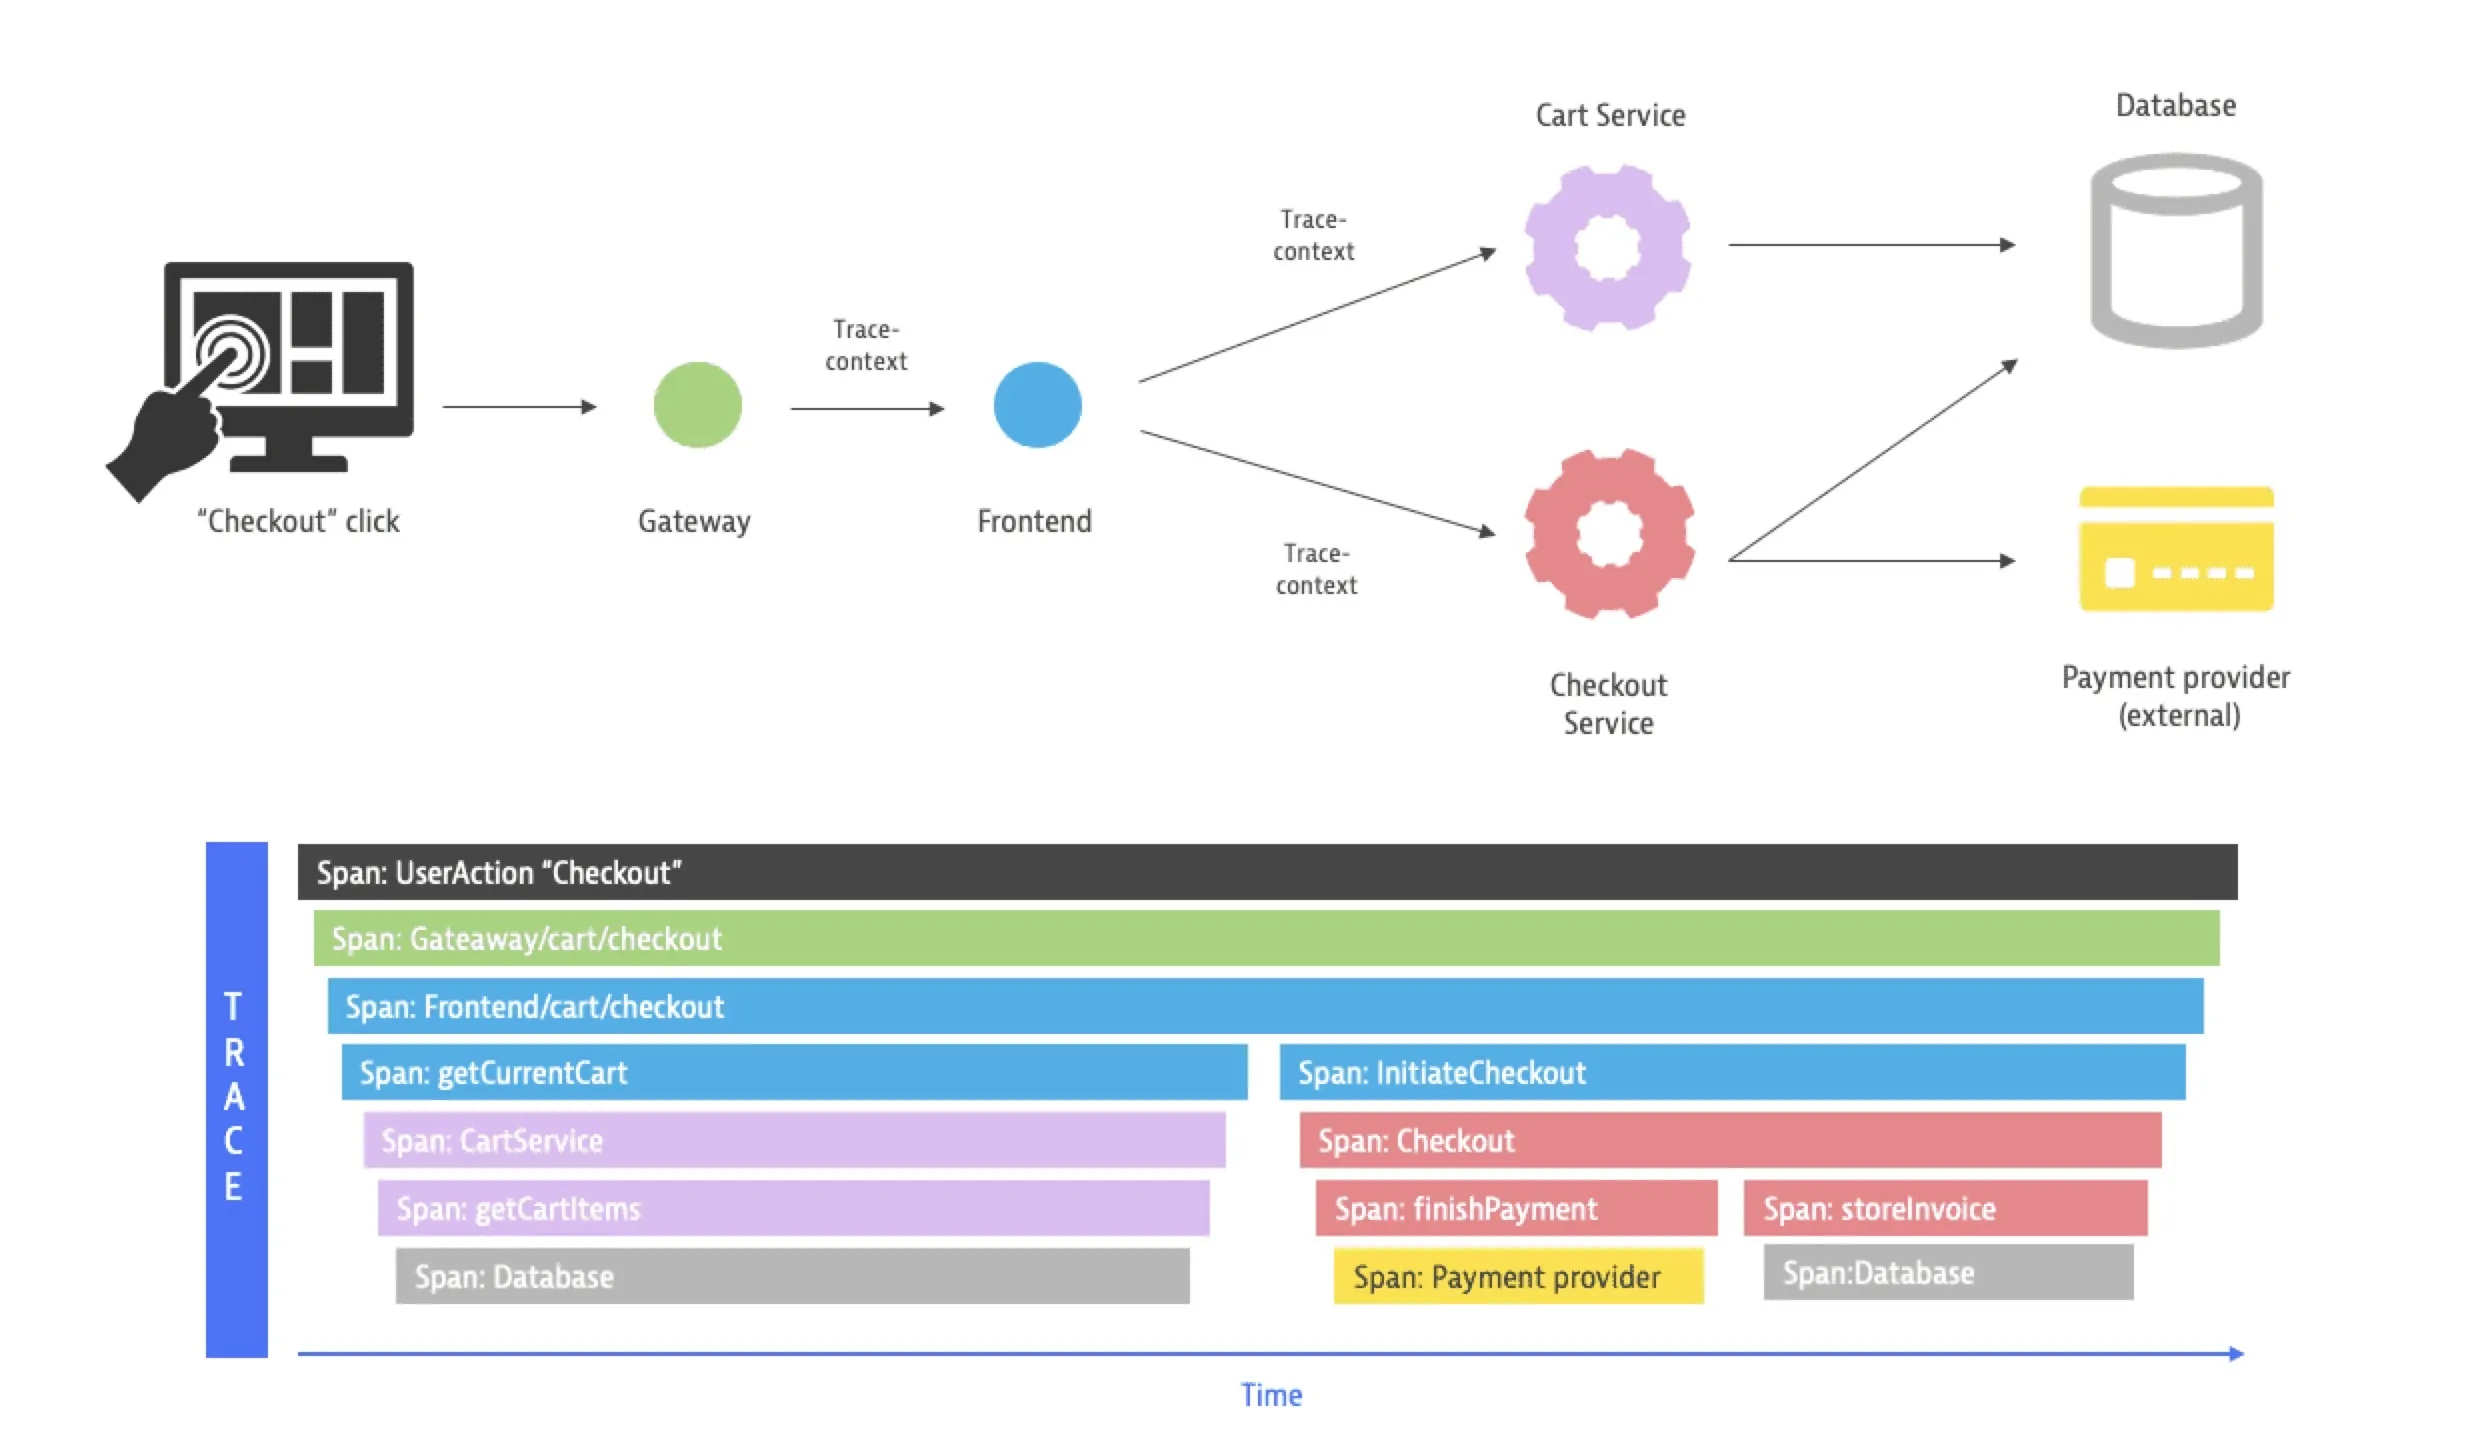
🏗️ Anatomy of a Trace
Example: E-commerce checkout

🔗 Relationships Between Spans
Spans in traces can be related in two ways:
- Parent-Child (hierarchy)
- Span Links (loose association).
👨👧 Parent-Child
A Parent-Child relationship means that the child span is part of the parent’s operation — it is invoked by the parent and executes in its context.
Root Span: HTTP GET /checkout         ← Parent
  ├── Child: validate-cart             ← depends on parent
  │   └── Child: db-query              ← nested child
  └── Child: process-payment           ← depends on parent
Characteristics:
- Child inherits TraceID from parent
- Child has a ParentSpanID pointing to the parent
- Child’s duration fits within the parent’s duration
- They form a call tree (hierarchy)
Code example (Go):
// Parent span
ctx, parentSpan := tracer.Start(ctx, "checkout")
defer parentSpan.End()

// Child span — automatically linked through ctx
ctx, childSpan := tracer.Start(ctx, "validate-cart")
defer childSpan.End()
🔗 Span Links
Span Links connect spans that are logically related but don’t have a parent-child relationship — they may belong to different traces or different branches of the same trace.
Trace A: order-placed
  └── Span: publish-to-queue ──────────┐
                                       │ Link
Trace B: order-processing              │
  └── Span: consume-from-queue ────────┘
Typical use cases:
- Batch processing — one span processes multiple messages, each from a different trace
- Async messaging — consumer links to the producer’s span (different traces)
- Fan-in — operation dependent on multiple previous operations from different traces
- Retries — new attempt links to the original span
Code example (Go):
// Consumer links to the producer's span from a different trace
link := trace.Link{ /*Link not Start*/
    SpanContext: producerSpanContext,
    Attributes: []attribute.KeyValue{
        attribute.String("messaging.operation", "process"),
    },
}

ctx, span := tracer.Start(ctx, "process-order",
    trace.WithLinks(link),
)
defer span.End()
Comparison:
| Aspect | Parent-Child | Span Links |
|---|---|---|
| Relationship | Hierarchical (tree) | Loose (graph) |
| TraceID | Same | Can be different |
| Time | Child fits within parent | No time constraints |
| Context | Propagated automatically | Added manually |
| Use case | Synchronous calls | Async, batch, fan-in |
📊 Benefits of Traces
🔍 Identifying Bottlenecks
Total request: 200ms
├── Authentication: 50ms (25%)
├── Cart validation: 80ms (40%) ← BOTTLENECK!
├── Payment: 150ms (75%) ← BOTTLENECK!
└── Order creation: 90ms (45%)
🚨 Debugging Errors
❌ Trace ID: abc123 - Payment Failed
├── ✅ Authentication: SUCCESS (45ms)
├── ✅ Cart validation: SUCCESS (75ms)
├── ❌ Payment processing: ERROR (timeout after 30s)
│   ├── ❌ Bank API: TIMEOUT (30s) ← ROOT CAUSE
│   └── ⚠️ Email: SKIPPED
└── ⚠️ Order creation: SKIPPED
📈 Performance Monitoring
- Latency percentiles (P50, P95, P99)
- Error rates per service
- Dependency mapping - which services talk to which
🌐 Trace Standards
🎯 OpenTelemetry (OTel) - Current Standard
JSON format:
{
  "traceId": "a1b2c3d4e5f6789012345678abcdef90",
  "spanId": "1234567890abcdef",
  "parentSpanId": "fedcba0987654321",
  "operationName": "payment-processing",
  "startTime": "2025-10-27T10:15:30.123456Z",
  "endTime": "2025-10-27T10:15:30.273456Z",
  "duration": 150000000,
  "status": {
    "code": "OK",
    "message": ""
  },
  "attributes": {
    "service.name": "payment-service",
    "service.version": "1.2.3",
    "http.method": "POST",
    "http.url": "/api/payment",
    "http.status_code": 200,
    "user.id": "user123",
    "payment.amount": 49.99,
    "payment.currency": "USD"
  },
  "events": [
    {
      "time": "2025-10-27T10:15:30.150000Z",
      "name": "bank.api.call.start",
      "attributes": {
        "bank.provider": "stripe"
      }
    }
  ]
}
OTel Span Structure:
- TraceID - unique identifier for the entire trace
- SpanID - unique identifier for the span
- ParentSpanID - parent’s ID (creates hierarchy)
- OperationName - operation name
- StartTime/EndTime - start and end timestamps
- Attributes - key-value metadata
- Events - points in time with additional data
- Status - success/error
🔄 Context Propagation
W3C Trace Context (standard)
# HTTP Headers
traceparent: 00-a1b2c3d4e5f6789012345678abcdef90-1234567890abcdef-01
tracestate: vendor1=value1,vendor2=value2
traceparent structure:
00-[trace-id]-[parent-span-id]-[trace-flags]
│  │          │               │
│  │          │               └── Flags (01 = sampled)
│  │          └── Parent Span ID (16 hex chars)
│  └── Trace ID (32 hex chars)
└── Version (00)
Code example (Go):
// HTTP Client - sending context
req.Header.Set("traceparent",
    fmt.Sprintf("00-%s-%s-01", traceID, spanID))

// HTTP Server - receiving context
traceParent := r.Header.Get("traceparent")
parts := strings.Split(traceParent, "-")
traceID := parts[1]
parentSpanID := parts[2]
📈 Sampling Strategies
🎲 Sampling types:
# Head-based sampling (Jaeger)
samplingStrategies:
  defaultStrategy:
    type: probabilistic
    param: 0.1  # 10% sampling

  perServiceStrategies:
    - service: "critical-service"
      type: ratelimiting
      maxTracesPerSecond: 100

    - service: "high-volume-service"
      type: probabilistic
      param: 0.01  # 1% sampling
🧠 Tail-based sampling (OTel Collector):
# Sampling after seeing complete trace
processors:
  tail_sampling:
    decision_wait: 10s
    policies:
      # Sample all errors
      - name: error-policy
        type: status_code
        status_code: {status_codes: [ERROR]}

      # Sample slow requests
      - name: latency-policy
        type: latency
        latency: {threshold_ms: 1000}

      # Sample 1% of normal traffic
      - name: probabilistic-policy
        type: probabilistic
        probabilistic: {sampling_percentage: 1}
Advantages:
- Decision made after seeing the complete trace — can filter by status, latency, attributes
- 100% of errors and anomalies reach the backend — no important trace is discarded
- Ability to define multiple policies (errors, slow requests, % of normal traffic)
- Better than head-based in environments where important traces are rare
Disadvantages:
- Requires buffering traces in the Collector until the decision is made (
decision_wait) — higher memory usage - All spans of a given trace must reach the same Collector — requires a load balancer with routing by
trace_id - Greater infrastructure complexity (dedicated Collector tier for sampling)
- Export delay — traces wait for
decision_waitbefore being sent further
🌐 Browser Tracing
OpenTelemetry enables browser instrumentation, allowing you to trace the entire request from user click to database response.
How does it work?
Browser (frontend)                    Backend
┌─────────────────────┐              ┌──────────────────┐
│ User click           │              │                  │
│  └── Span: onClick   │  HTTP + W3C │                  │
│       └── Span: fetch ──────────────→ Span: /api/order │
│            (traceparent)│           │  └── Span: db    │
└─────────────────────┘              └──────────────────┘

A single trace connects frontend and backend thanks to W3C Trace Context propagation.
What can be traced in the browser?
| Signal | Description |
|---|---|
| Document Load | Page load time (DNS, TCP, TTFB, DOM) |
| HTTP/Fetch requests | XHR and Fetch with automatic traceparent propagation |
| User Interactions | Clicks, navigations, form submissions |
| Web Vitals | LCP, FID, CLS — Core Web Vitals as spans/metrics |
| Errors & Exceptions | Unhandled JS errors, promise rejections |
| Custom spans | Custom instrumentation of business logic |
Configuration (JavaScript)
import { WebTracerProvider } from '@opentelemetry/sdk-trace-web';
import { BatchSpanProcessor } from '@opentelemetry/sdk-trace-base';
import { OTLPTraceExporter } from '@opentelemetry/exporter-trace-otlp-http';
import { ZoneContextManager } from '@opentelemetry/context-zone';
import { registerInstrumentations } from '@opentelemetry/instrumentation';
import { getWebAutoInstrumentations } from '@opentelemetry/auto-instrumentations-web';

const provider = new WebTracerProvider({
  resource: {
    attributes: {
      'service.name': 'frontend-app',
      'service.version': '1.0.0',
    },
  },
});

// Export traces to OTel Collector
provider.addSpanProcessor(
  new BatchSpanProcessor(
    new OTLPTraceExporter({
      url: 'https://otel-collector.example.com/v1/traces',
    })
  )
);

// ZoneContextManager ensures proper context propagation
// in asynchronous browser code (setTimeout, fetch, Promise)
provider.register({
  contextManager: new ZoneContextManager(),
});

// Auto-instrumentation: document load, fetch, user interactions
registerInstrumentations({
  instrumentations: [
    getWebAutoInstrumentations({
      '@opentelemetry/instrumentation-document-load': {},
      '@opentelemetry/instrumentation-fetch': {
        propagateTraceHeaderCorsUrls: [/api\.example\.com/],
      },
      '@opentelemetry/instrumentation-user-interaction': {},
    }),
  ],
});
Custom span in the browser
const tracer = provider.getTracer('frontend-app');

function addToCart(productId) {
  const span = tracer.startSpan('add-to-cart', {
    attributes: {
      'product.id': productId,
      'component': 'cart',
    },
  });

  try {
    // business logic...
    span.setStatus({ code: SpanStatusCode.OK });
  } catch (error) {
    span.setStatus({ code: SpanStatusCode.ERROR, message: error.message });
    span.recordException(error);
    throw error;
  } finally {
    span.end();
  }
}
CORS and Propagation
For the traceparent header to be sent to a backend on a different domain, the backend must allow this header in CORS:
Access-Control-Allow-Headers: traceparent, tracestate
Without this, the browser will strip the header and the trace will be broken at the frontend → backend boundary.
Export Architecture
Browser → OTel Collector → Backend (Tempo/Jaeger)
                ↑
   OTLP/HTTP (not gRPC!)
Note: Browsers do not support gRPC — the exporter must use OTLP/HTTP (
/v1/traces). The OTel Collector should expose an HTTP endpoint (default port4318).