Profiles (eBPF)
🔬 4th Pillar of Observability - Profiles (eBPF)
What are they for?
Understanding what exactly your code does at runtime — CPU, memory, allocations, locks
📍 What are profiles?
Profiles are the fourth telemetry signal in OpenTelemetry (alongside logs, metrics, and traces), providing detailed information about how an application uses system resources in real time.
Key characteristics:
- Show which functions/lines of code consume CPU, memory, or other resources
- Enable continuous profiling — continuous collection of profiling data in production (not just during debugging)
- In OpenTelemetry: data model stable (since 2024), SDK implementation in progress
What a profile contains:
Stack trace sample (CPU profile):
──────────────────────────────────────
main.handleRequest()                    ← 45% CPU
  └── db.QueryContext()                 ← 30% CPU
       └── net/http.(*conn).readRequest ← 10% CPU
  └── json.Marshal()                    ← 5% CPU
Each sample contains:
- Stack trace — full function call path
- Value — how much of the resource was consumed (CPU cycles, memory bytes, allocation count)
- Labels — context (service name, environment, etc.)
- Timestamp — when the sample was collected
🐝 eBPF — The Foundation of Modern Profiling
eBPF (extended Berkeley Packet Filter) is a Linux kernel technology that allows running sandboxed programs in kernel space without modifying the kernel source code or loading modules.
Why eBPF is crucial for profiling:
| Aspect | Traditional Profiling | eBPF Profiling |
|---|---|---|
| Overhead | 5-20% (e.g., Java Flight Recorder) | < 1% |
| Code changes required | Yes (agent/library) | No — operates at kernel level |
| Languages | Language-specific | Any language (observes syscalls) |
| Security | Agent in process | Sandboxed in kernel |
| Visibility | User-space only | User-space + kernel-space |
How eBPF profiling works:

Key eBPF mechanisms:
perf_event— periodic stack trace sampling (e.g., every 10ms) → CPU profilekprobe/kretprobe— hooking kernel functions (e.g., memory allocations, I/O operations)uprobe/uretprobe— hooking user-space functions without restarting the process- eBPF Maps — shared memory kernel ↔ user-space for passing samples
🔥 Flame Graphs
Profiles are most commonly visualized as flame graphs:
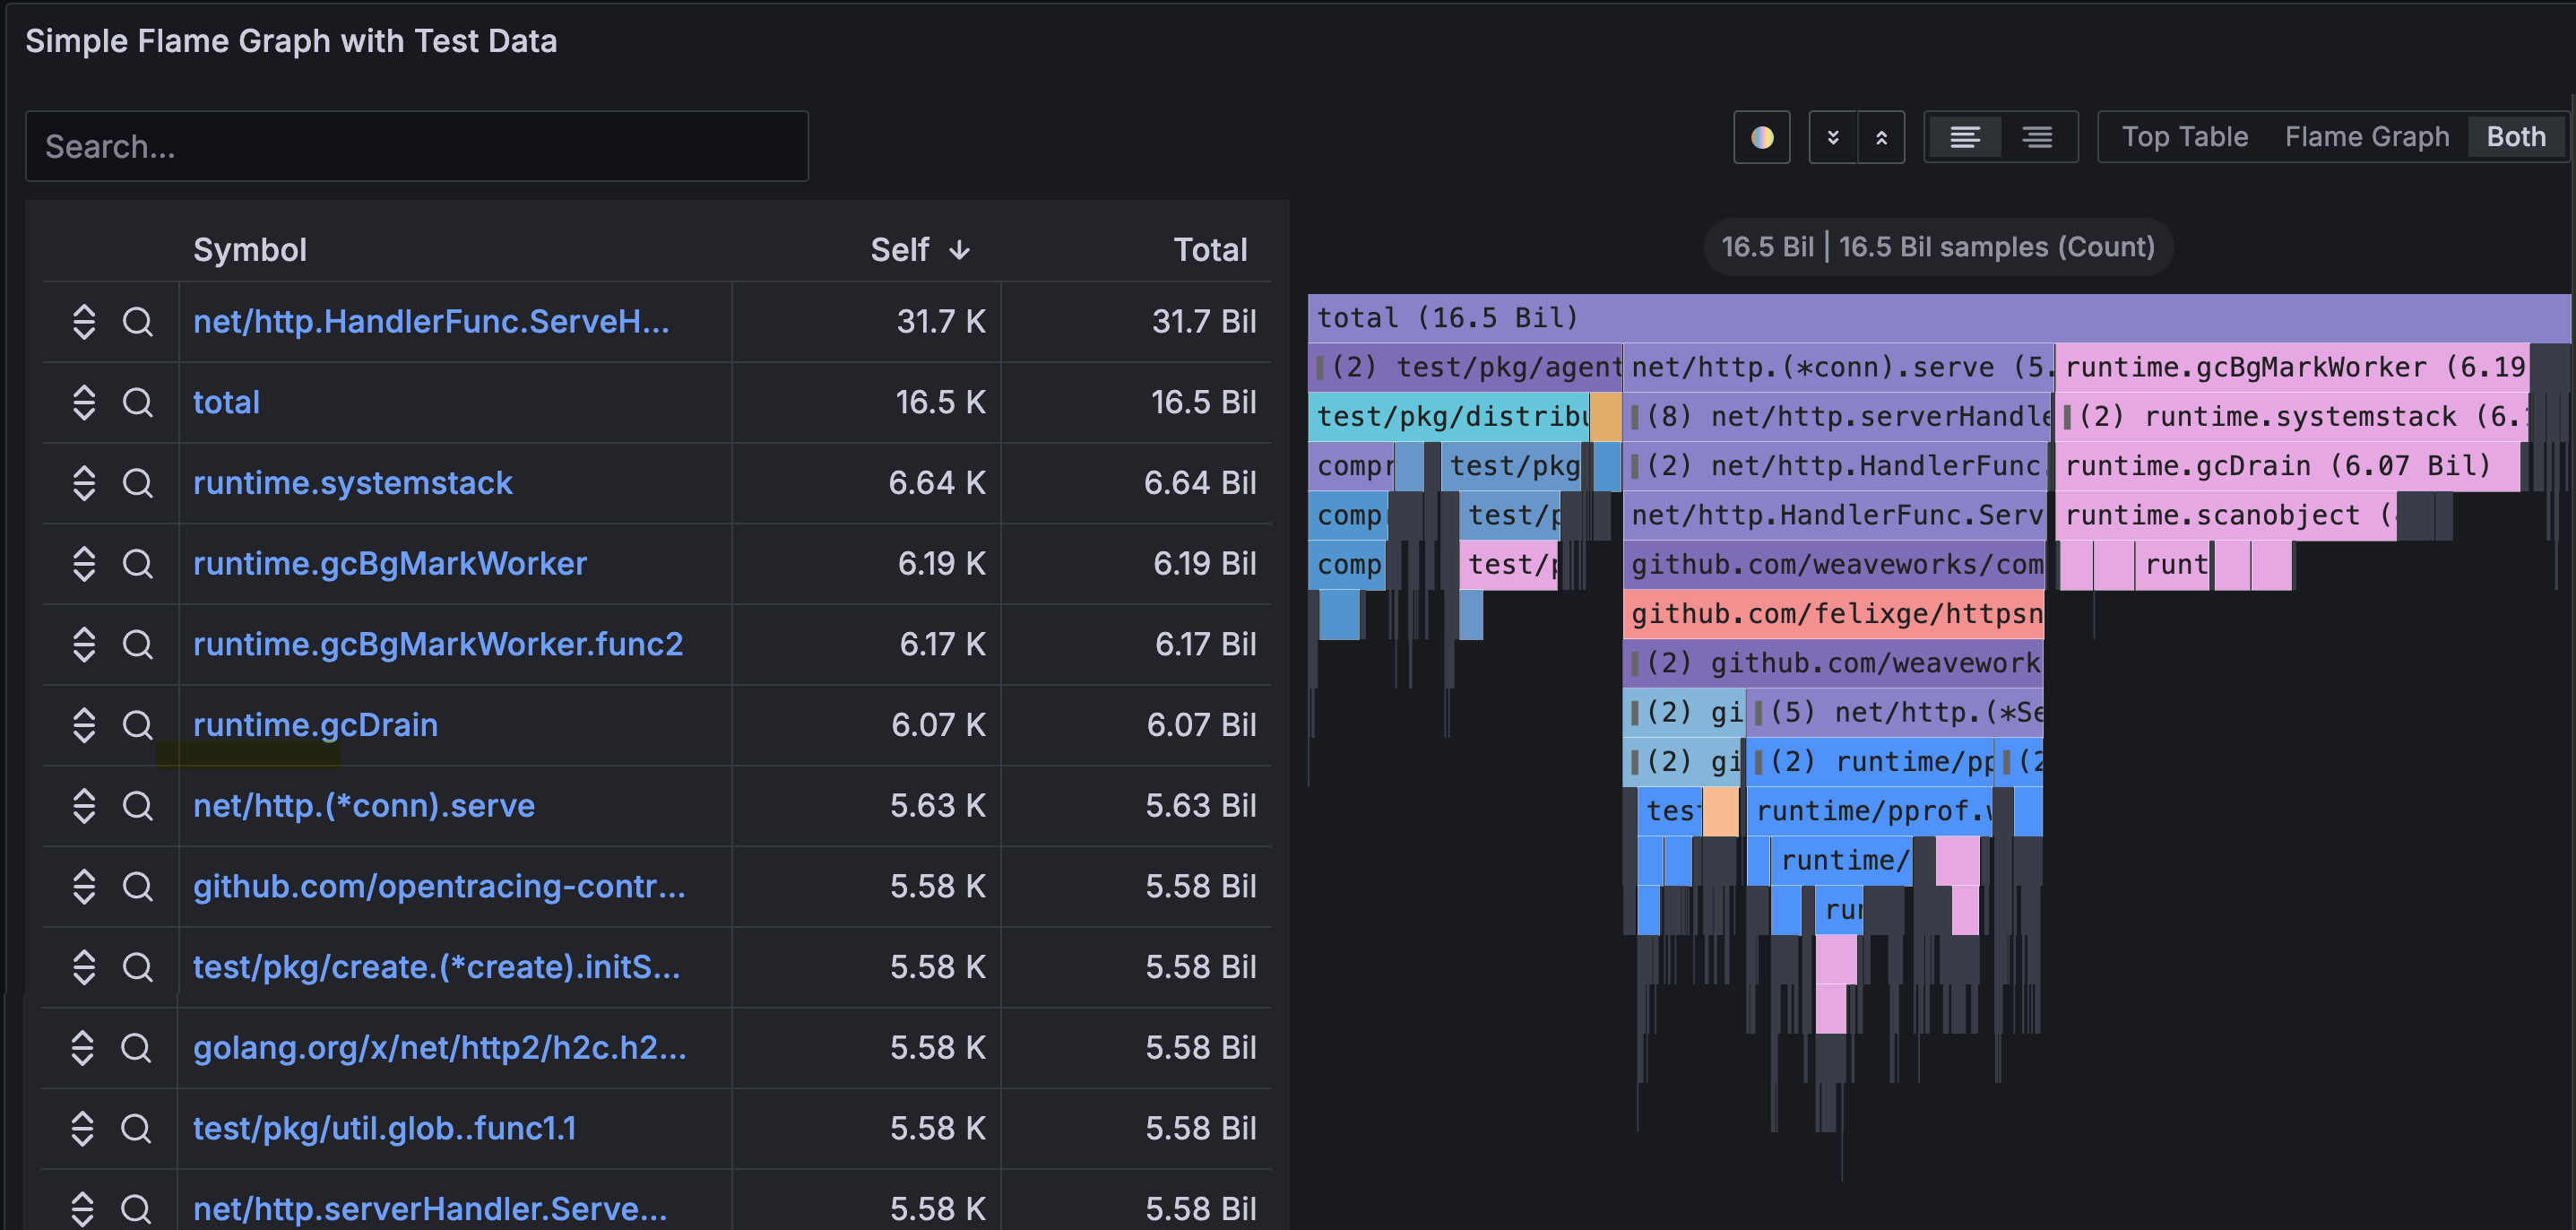
How to read a flame graph:
- Wide blocks at the top → functions that themselves consume many resources (hot spots)
- Wide blocks at the bottom → functions that call expensive subtrees
- Flame graph comparison (diff) → what changed between deployment versions
📊 Profile Types
| Profile Type | What it measures | Unit | When to use |
|---|---|---|---|
| CPU | Time spent executing code | nanoseconds / cycles | High CPU usage, slow endpoints |
| Heap (Alloc) | Currently allocated memory | bytes | Memory leaks, high RAM usage |
| Goroutine / Thread | Number of active threads/goroutines | count | Goroutine leaks, deadlocks |
| Mutex / Lock | Time spent waiting for locks | nanoseconds | Contention, slow concurrency |
| Block / I/O | Time blocked on I/O operations | nanoseconds | Slow network/disk operations |
| Off-CPU | Time when thread is NOT on CPU | nanoseconds | Waiting for I/O, scheduling |
🛠️ Continuous Profiling Tools
Grafana Pyroscope (recommended in Grafana Stack)
# Example Pyroscope configuration with Grafana Alloy (eBPF)
pyroscope.ebpf "instance" {
  forward_to     = [pyroscope.write.endpoint.receiver]
  targets_only   = false
  default_target = {"service_name" = "unspecified"}
  demangle       = "none"
  sample_rate    = 97   // Hz - samples per second
}

pyroscope.write "endpoint" {
  endpoint {
    url = "http://pyroscope:4040"
  }
}
Parca (open-source, CNCF sandbox)
# parca-agent as DaemonSet in Kubernetes
apiVersion: apps/v1
kind: DaemonSet
metadata:
  name: parca-agent
spec:
  template:
    spec:
      containers:
        - name: parca-agent
          image: ghcr.io/parca-dev/parca-agent
          securityContext:
            privileged: true   # required for eBPF
          args:
            - /bin/parca-agent
            - --node=$(NODE_NAME)
            - --store-address=parca-server:7070
OpenTelemetry Profiling (in development)
OTel Profiling Pipeline:

  Application / eBPF Agent
         │
         ▼
  OTel Collector
  (profilesreceiver)       ← new receiver for profiles
         │
         ▼
  Backend (Pyroscope / Parca / Datadog / Elastic)
🔗 Correlating Profiles with Other Signals
The greatest value of profiles emerges when they are correlated with other signals:
📈 Metric: CPU usage spike → 95%
    │
    ├── 🔍 Trace: GET /api/reports (span: 12.5s)
    │       │
    │       └── 🔬 Profile: json.Marshal() → 78% CPU in this span
    │                  └── Conclusion: serialization of a large object
    │
    └── 🪵 Log: "Report generation completed" (duration: 12.5s)
How it works in practice:
- Span → Profile: OpenTelemetry links
span_idwith profile samples → click on a slow span and see which functions are slowing it down - Metric → Profile: Grafana allows navigating from a metrics dashboard to a flame graph from the same time period
- Profile → Log: Flame graph points to a function → log shows what happened inside it
⚡ When to use profiles?
- ✅ Performance optimization — finding hot spots in production code
- ✅ Memory leak diagnosis — heap profile shows what’s holding memory
- ✅ Regression analysis — comparing profiles before and after deployment (diff flame graph)
- ✅ Cloud cost reduction — identifying inefficient code → smaller instances
- ✅ Latency debugging — when a trace shows a slow span, the profile shows why
- ❌ Does not replace traces or metrics — it’s a complementary signal
💡 Tip: Start with a CPU profile using eBPF (zero code changes, < 1% overhead), then add heap/goroutine profiles for specific problems.
🔗 Four Pillars Together
Logs     → What happened
Metrics  → How often / how long
Traces   → Where and why
Profiles → Why so slow / what consumes resources
➡️ Together they provide a complete picture of system behavior