🎯Exercises
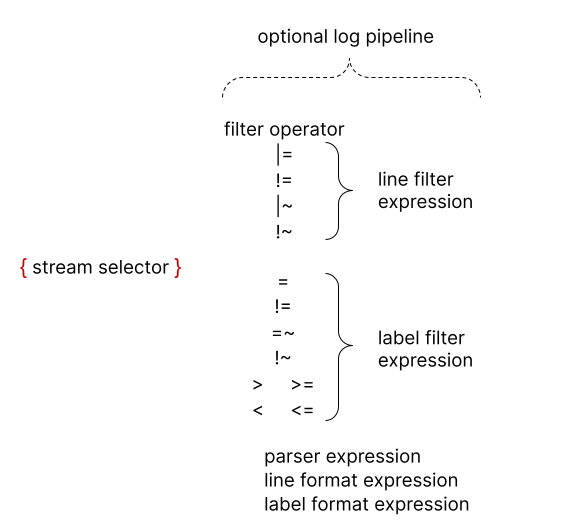
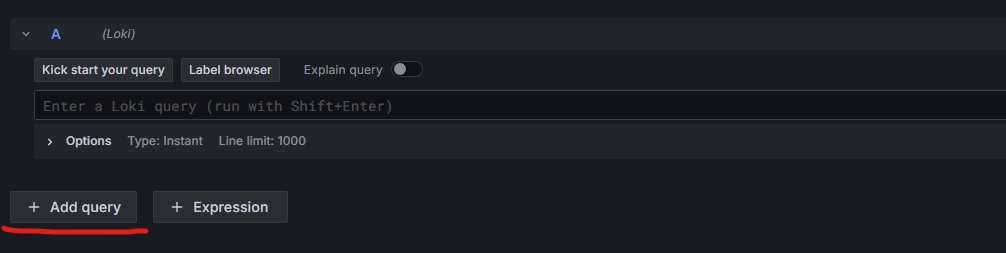
Query Structure
Loki Query Analyzer
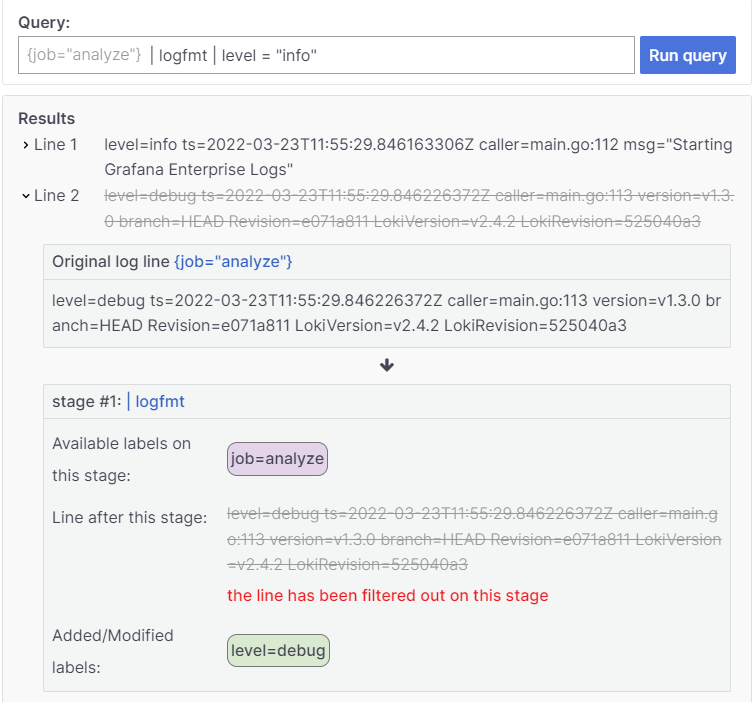 Grafana released an online Loki query analyzer that shows the analysis step by step.
Basic LogQL (Loki Query Language) Syntax Elements:
Labels
Used to filter logs. They are key-value pairs assigned to each log entry.
❗The examples below use generic values. To make them work in the Loki instance you will need to change them accordingly. No copy-paste :)
{app="my-app"}
Label Operators
-
=- Exact matching of logs with a label{app="my-app"} - Matching multiple labels. The following matches logs with both labels
{app="my-app",name="mysql-backup"} -
!=- Exact matching of logs without a label{app !="my-app"} -
=~Matching logs with labels using regex{app =~".*mysql.*"} -
!~Matching logs without labels using regex{app !~".*mysql.*"}
Filtering
Processing of selected logs
Text Filtering
-
|=- Searches for logs containing specified text.{app="web-app"} |= "error" -
!=- Searches for logs NOT containing specified text.{app="web-app"} != "error" -
|~- Searches for logs matching a regular expression.{app="web-app"} |~ "er.*" -
!~- Searches for logs NOT matching a regular expression.{app="web-app"} !~ "er.*"
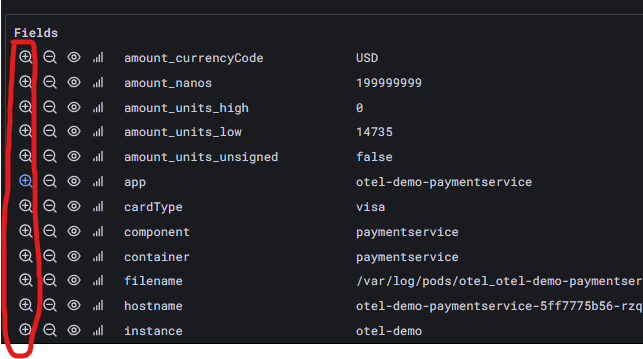
Detected Fields
Loki automatically parses logs and extracts values from them. They are displayed in the UI as follows:
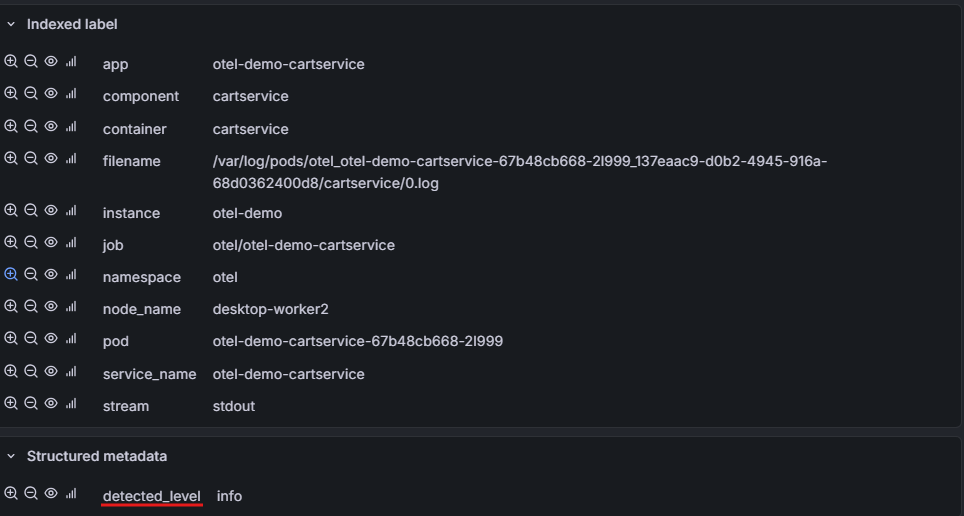
The app and namespace fields are labels and can be referenced with this syntax:
{namespace="default",app="webspa"}
The detected_level field is not a label and using it like a label will not work:
{namespace="default",app="webspa", detected_level="error"}
However, this syntax will work:
{namespace="default",app="webspa"} | detected_level="error"
Exercises
1. Stream Selection
1.1 Selection by namespace
🎯 Goal: Search for logs from applications in the Kubernetes namespace otel.
1.2 Basic query
🎯 Goal: Search for logs from the ad application in the Kubernetes namespace otel.
1.3 Regex
🎯 Goal: Search for logs from all applications whose name contains a hyphen (-) in namespace otel
2. Text Search
2.1 Text search
🎯 Goal: Search for logs in applications in the Kubernetes namespace otel that contain the phrase error in their content.
Also check the results for Error.
2.2 Detected fields
⚠️ Loki tries to automatically detect certain fields. These fields used to be indistinguishable, but now they have a
detected_prefix.
🎯 Goal: Search for logs in applications in the Kubernetes namespace otel where the detected field detected_level has the value info.
2.3 Chaining filters
⚠️ Remember that in Loki syntax you can chain filters. That is:
{namespace="example"} | SOMETHING | SOMETHING | SOMETHING
🎯 Goal: Search for logs in applications in the Kubernetes namespace otel that contain the phrase error in their content, but the detected field level does not have the value error.
2.4 Chaining filters part two
🎯 Goal: Search for logs in applications in the Kubernetes namespace otel that have errors (error) in grpc communication.
Extra:
Check if the list differs when you search for the phrase Error (starting with a capital letter).
3. Aggregations
Functions
We have 5 basic aggregation functions:
rate(log-range)- number of entries per secondcount_over_time(log-range)- counting occurrences.bytes_rate(log-range)- number of bytes per secondbytes_over_time(log-range)- counting the number of bytes.absent_over_time(log-range)- returns1when there are no entries matching the query, empty result when there are.
Time
These functions are used in the format:
AGGREGATION_FUNCTION( QUERY [TIME_VECTOR_SIZE] )
Where:
- AGGREGATION_FUNCTION - the previously mentioned aggregation functions
- QUERY - a query selecting logs as in section 1
- TIME_VECTOR_SIZE - how far back in time for each measurement second
Understanding Aggregations and Time
❗Perform the following exercises on a graph in Points mode:

3.1 Time in summing functions
To understand, compare the behavior of 2 queries:
One with a 1s vector
bytes_over_time({namespace="otel", app="cart"} |= "http" [1s])
Another with a 1h vector
bytes_over_time({namespace="otel", app="cart"} |= "http" [1h])
Pay attention to the Y-axis scale of the chart.
🎯 Questions/tasks:
- How do these charts differ?
- What is the reason for the difference?
- Modify the vector size (value in brackets
[]) and observe what happens.
3.2 Time in rate functions
Now compare the behavior for rate functions (previously we discussed summing functions) by comparing results for queries that measure the number of occurrences per second:
With a 1s range
bytes_rate({namespace="otel", app="cart"} |= "http" [1s])
And with a 1h range
bytes_rate({namespace="otel", app="cart"} |= "http" [1h])
🎯 Questions/tasks:
- How do these charts differ?
- What is the reason for the difference?
- Modify the vector size (value in brackets
[]) and observe what happens. - Check how frequently the points are spaced.
3.3 How much logs do applications produce
🎯 Goal: Compare how many log lines each service in the otel namespace produces
Tips and tricks:
⚠️
count_over_timegroups by stream, not application. ⚠️ Stream grouping can be achieved by using thesumfunction as follows:sum ( AGGREGATION ) by (GROUPING_LABEL)
4. Parsing and Processing
If logs are in one of the known formats, they can be parsed to reference their fields. Functions:
- json
- logfmt
- pattern
After parsing logs, you can use them in the line_format function using calls like: line_format "-some text".
Where:
- `` - marks a variable occurrence
.PROPERTY_NAME- path to the property
4.1 Pattern
🎯 Goal: From the otel namespace for the email application, extract the IP addresses from which HTTP connections are made.
⚠️ Tips and tricks:
- Description of how the syntax works
- The
10.244.2.52 - - [05/Feb/2026:15:07:31 +0000] "POST /send_order_confirmation HTTP/1.1" 200 - 0.0131- To filter only HTTP logs, use the filter
|= "HTTP"
4.2 JSON
🎯 Goal: For the cart application (OTLP stream — exporter="OTLP") extract the request duration from logs like:
{
  "body": "Request finished HTTP/2 POST http://cart:8080/oteldemo.CartService/GetCart - 200 - application/grpc 182.2745ms",
  "attributes": {
    "ElapsedMilliseconds": 182.2745,
    "Method": "POST",
    "Path": "/oteldemo.CartService/GetCart",
    "StatusCode": 200
  }
}
⚠️ Tips and tricks:
- OTLP logs have the label
exporter="OTLP"(they don’t have anamespacelabel) - The
jsonfunction - parses JSON logs into key-value format - The
keepfunction - allows keeping only specific key-value pairs for further processing - Loki flattens nested JSON objects with underscores, e.g.,
attributes.ElapsedMilliseconds→attributes_ElapsedMilliseconds - In
Tablemode, parsed properties and potential errors are easier to see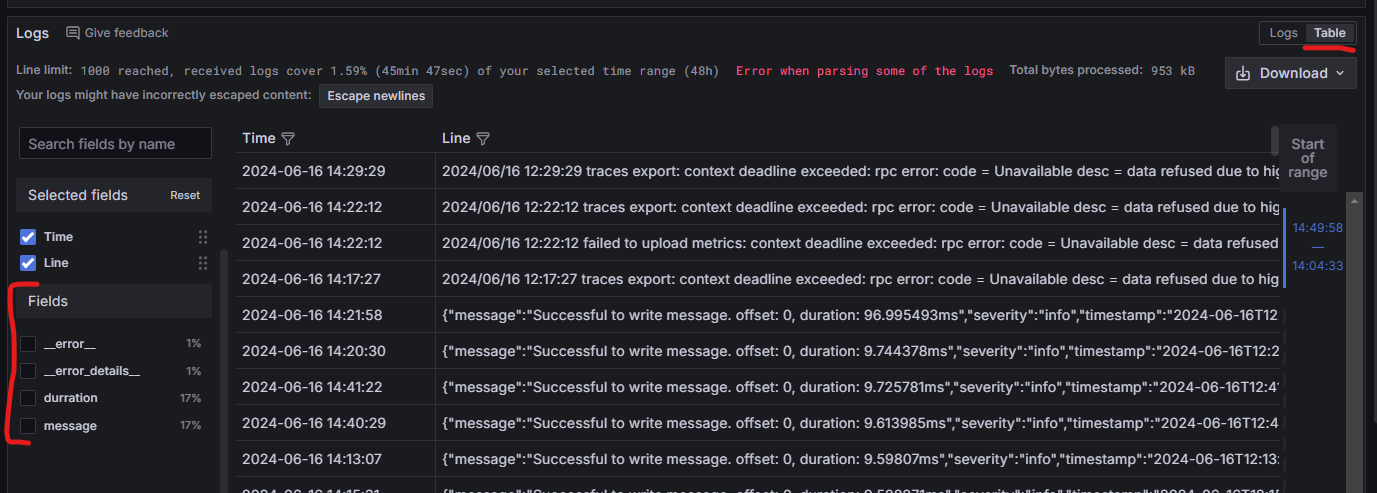
4.3 Comparison
🎯 Goal: Display only logs from the payment application (OTLP stream — exporter="OTLP") where the value of the attributes_amount_units_low field is greater than 100
⚠️ Tips and tricks:
- Loki automatically handles type casting.
- If you don’t know the syntax, remember that the UI has autocomplete and the ability to “click through” searches by selecting interesting fields in the UI.
4.4 Aggregation by custom fields
🎯 Goal: Calculate the sum of attributes_amount_units_low values in the payment application (OTLP stream — exporter="OTLP") grouped by currency (field attributes_amount_currencyCode).
⚠️ Tips and tricks:
- Use the query from the previous exercise as a starting point.
- Break the query writing into two stages:
- Aggregation of the selected property.
- Grouping the resulting data.
- Custom property aggregation can be done using the
sum_over_timefunction- To specify which property to sum, it must be used in an
unwrapexpression in the formunwrap PROPERTY. A pretty good explanation ofunwrapis in this article sum_over_timedoes not support grouping.
- To specify which property to sum, it must be used in an
- Check the Loki documentation for built-in aggregation operators.
4.5 Errors are relative
🎯 Goal: Place the following data on a single chart:
- Create a chart showing the percentage of error logs to all logs for the top 3 applications in the
otelnamespace - Overlay the same chart as above, but shifted by 5m
For all charts, the legend should show the application name. For applications with offset, the legend should have a -offset postfix.
⚠️ Tips and tricks:
- The
topkfunction - Loki has automatic float conversion.
- Time shifting is done using the
offsetfunction - A single chart can have multiple queries:
5. Monitoring Frequency and Performance
5.1 rate() — error frequency
⚠️ The
paymentservice has thepaymentFailurefeature flag enabled, which causes ~10% transaction errors. This gives us a steady stream of errors to analyze.
🎯 Goal: Calculate how many errors per second the payment service generates in the otel namespace.
⚠️ Tips and tricks:
rate()returns the number of entries per second, unlikecount_over_time()which returns the total sum- Compare the results of
rate()andcount_over_time()for the same query — how do they differ?
5.2 avg_over_time — average response time
⚠️ This exercise builds on the query from exercise 4.2 — use it as a starting point.
🎯 Goal: Calculate the average response time (in ms) for the cart application (OTLP stream — exporter="OTLP") based on the attributes_ElapsedMilliseconds field. Group results by endpoint (attributes_Path).
⚠️ Tips and tricks:
avg_over_timeworks analogously tosum_over_time— requiresunwrap- Syntax:
avg_over_time(QUERY | unwrap FIELD [RANGE]) by (LABEL)
5.3 quantile_over_time — percentiles (p95)
🎯 Goal: Calculate the 95th percentile of response time for the cart application (OTLP stream). Compare it with the average from exercise 5.2 on a single chart.
⚠️ Tips and tricks:
- Syntax:
quantile_over_time(PERCENTILE, QUERY | unwrap FIELD [RANGE]) - Percentile is specified as a fraction: 0.95 = p95, 0.99 = p99
- Use two queries on a single chart (as in exercise 4.5)
- Percentiles are crucial when defining SLO/SLI
5.4 label_replace — readable legends
🎯 Goal: Take the query from exercise 3.3 (how many logs each service produces) and change the chart labels so that instead of the application name (e.g., cart), it displays the name with a svc: prefix (e.g., svc: cart).
⚠️ Tips and tricks:
- In metric queries (with aggregation functions), use
label_replaceto change labels - Syntax:
label_replace(QUERY, "TARGET_LABEL", "REPLACEMENT", "SOURCE_LABEL", "REGEX") - In
REPLACEMENT, you can reference regex groups with$1,$2, etc. - In log queries (without aggregation functions), use
label_formatto change labels in the form:| label_format LABEL=" some text"
5.5 absent_over_time — detecting dead services
🎯 Goal: Write a query that returns a value of 1 when the currency service in the otel namespace has not produced any logs in the last 5 minutes. Such a query could be used as the basis for a “service is dead” alert.
⚠️ Tips and tricks:
absent_over_timereturns1when there are no logs matching the condition in the specified range- Test: change the application name to a non-existent one (e.g.,
app="doesnotexist") to see a result of1 - In production, such queries are combined with Grafana Alerting