Internal Mechanisms
Internal mechanisms
Prometheus storage
- You can use the default local disk storage, or optionally a remote storage system.
- Local storage: local time series database in Prometheus’s custom format.
- Remote storage: you can read/write samples to a remote system in standard format.
- Currently uses snappy-compressed buffer protocol over HTTP, but may change in the future (to gRPC or HTTP/2)
- Remote storage focuses primarily on long-term storage
- Adapters are currently available for the following solutions. https://prometheus.io/docs/operating/integrations/#remote-endpoints-and-storage
- Prometheus >=2.0 uses a new storage engine that dramatically increases scalability.
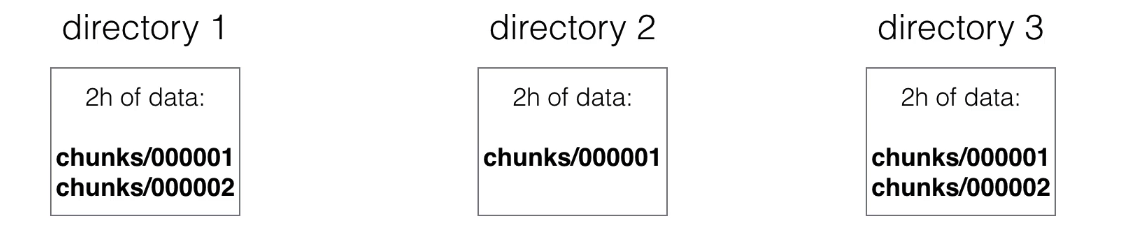
- Scraped samples are grouped into two-hour blocks.
- These 2-hour samples are stored in separate directories (in prometheus data directory).
-
Writes are grouped and written to disk in chunks, containing multiple data points.
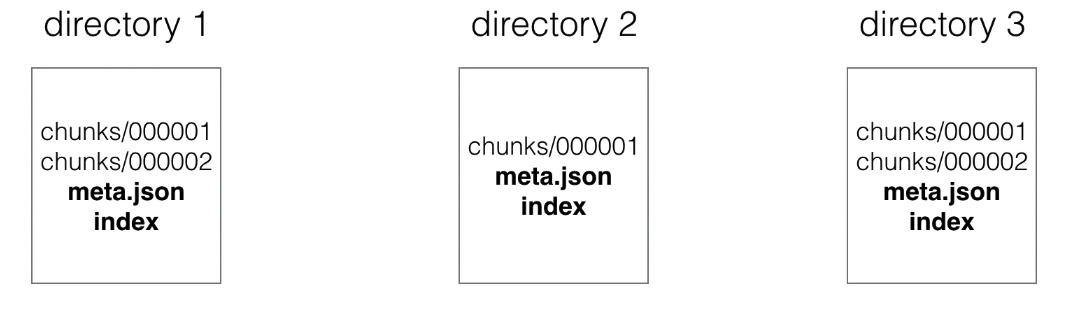
- Each directory also has an index file (index) and a metadata file (meta.json).
-
It stores metric names and labels, and provides an index from metric names and labels to series in chunk files.
- The newest data is stored in memory.
-
You don’t want to lose in-memory data during a failure, so data also must be persisted to disk. This is done using write-ahead-log (WAL).
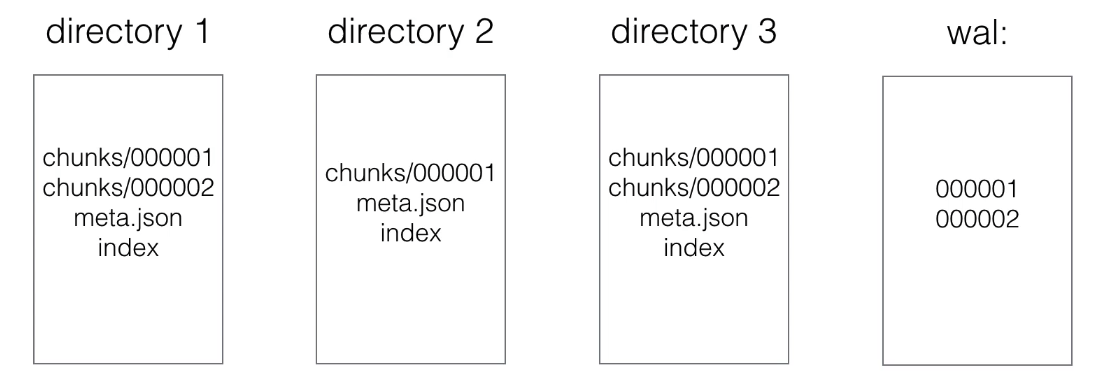
- Write Ahead Log (WAL)
- Appending to a file (like a log) is faster than performing (many) random reads/writes.
- If a server failure occurs and in-memory data is lost, WAL will be replayed.
- This way no data will be lost or corrupted during failure.
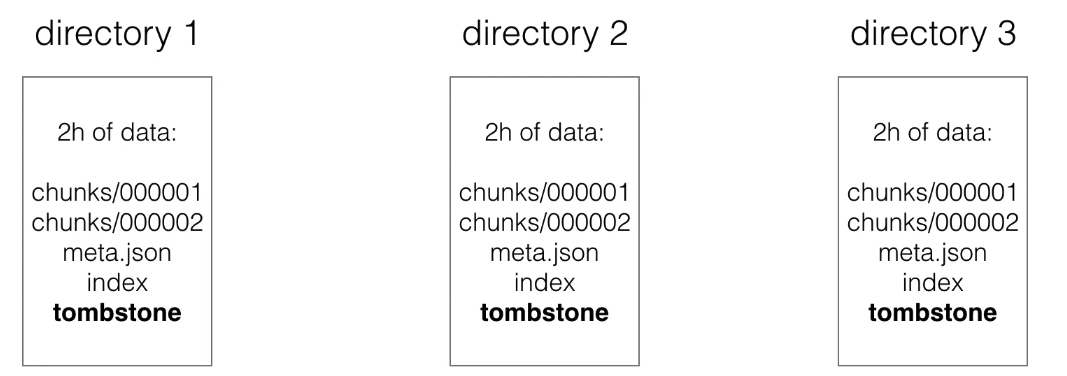
- When series are deleted, a tombstone file is created.
-
This is more efficient than immediately deleting data from chunk files, because actual deletion can happen later (e.g., when there’s no heavy load)
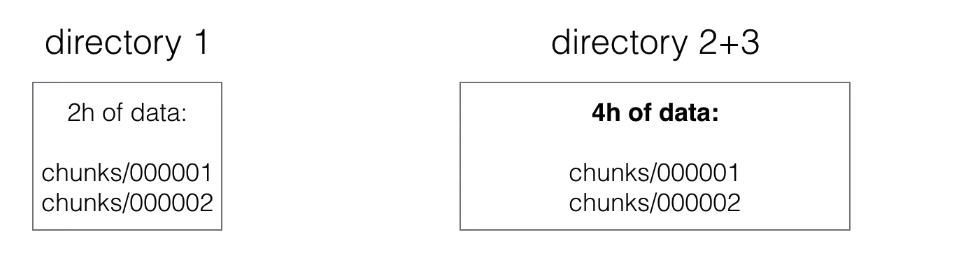
- Initial 2-hour blocks are merged in the background creating longer blocks.
-
This is called compacting.
- Block characteristics:
- A block in the file system is a directory with chunks.
- You can view each block as a completely independent database containing all time series for a window.
- Each data block, except the current block, is immutable (no changes can be made).
- These non-overlapping blocks are actually horizontal partitioning of scraped time series data.
- This horizontal partitioning provides many benefits:
- During queries, blocks not fitting the time range can be skipped.
- When finishing a block, data only needs to be appended, not modified (avoids write-amplification)
- Newest data is stored in memory, so it can be searched faster.
- Deleting old data is just a matter of removing directories from the file system.
- Compaction:
- During queries, blocks must be merged together to calculate results.
- Too many blocks can cause excessive merging overhead, so blocks are compacted.
- 2 blocks are merged and create a newly formed (often larger) block.
- Compaction can also modify data: remove deleted data or restructure chunks to increase query performance.
- Index:
- Having horizontal partitioning already makes most queries faster, but not those that must go through all data to get a result
- The index is an inverted index providing better query performance, also in cases where all data must be searched
- Each series receives a unique ID (e.g., ID 1 and 2)
- The index will contain an inverted index for labels, for example for label env=production, it will have 1 and 3 as IDs if those series contain the label env=production.
- What about disk size?
- On average, Prometheus needs 1-2 bytes per sample.
- You can use the following formula to calculate needed disk space:
needed_disk_space = retention_time_seconds * scraped_samples_per_second * bytes_per_sample
- How to reduce disk size?
- You can increase scrape interval, which gives you less data.
- You can reduce the number of targets or series you scrape.
- Or you can reduce retention (how long you keep data)
--storage.tsdb.retention: This specifies when to delete old data. Default 15d.
- To read the full history of the Prometheus time series database, read the documentation: https://github.com/prometheus/prometheus/tree/main/tsdb/docs/format
Prometheus security
- Currently Prometheus offers no support for authentication or encryption (TLS) on server components.
- They argue that they focus on building a monitoring solution, and want to avoid the need to implement complex security features.
- You can still enable authentication and TLS using a reverse proxy.
- This is important only for server components, prometheus can scrape targets with TLS and authentication enabled
- See tls_config in prometheus configuration to configure CA certificate, user certificate and user key.
- You will still need to configure reverse proxy for the targets themselves.