OpenTelemetry Architecture

🏗️ Main OTel Components
- SDK & API – libraries in applications
- Instrumentation Libraries – ready-made integrations
- OpenTelemetry Collector – central data processing point
🗺️ Observability Architecture in Our Solution
flowchart TB
    subgraph sources ["Data Sources"]
        app["Applications\n(instrumented with OTel SDK)"]

        subgraph k8s ["Kubernetes"]
            ksm["kube-state-metrics"]
            node["node-exporter"]
            kubelet["kubelet"]
        end

        subgraph exporters ["Exporters"]
            pg["PostgreSQL Exporter\n:9187"]
            redis["Redis Exporter\n:9121"]
        end

        nodes["All node processes\n(eBPF target)"]
    end

    subgraph alloy_gw ["alloy — Deployment + HPA (2–6) + Clustering"]
        direction LR
        otel_recv["OTLP Receiver\n:4317 gRPC / :4318 HTTP"]
        scraper["Prometheus Scraper\nServiceMonitors + Pod Annotations\n(targets sharded across replicas)"]
        sdk_prof["pyroscope.scrape\n(SDK profiles, sharded)"]
    end

    subgraph alloy_col ["alloy-collector — DaemonSet (1 / node)"]
        direction LR
        log_scrape["Log Scraper\nPod stdout/stderr\n(/var/log/pods on this node)"]
        ebpf_prof["pyroscope.ebpf\n(node-local CPU profiling)"]
    end

    %% Applications → Alloy gateway (OTLP)
    app -- "OTLP\n(traces, metrics, logs)\nalloy.monitoring:4317/4318" --> otel_recv

    %% Kubernetes metrics → Alloy gateway (scrape)
    k8s -- "scrape metrics" --> scraper
    exporters -- "scrape metrics" --> scraper

    %% SDK profiles pulled by gateway
    app -. "/debug/pprof scrape" .-> sdk_prof

    %% Pod logs collected by per-node DaemonSet
    app -. "stdout/stderr\n(pod logs)" .-> log_scrape

    %% eBPF profiles all node processes
    nodes -. "kernel sampling 97 Hz" .-> ebpf_prof

    prometheus["Prometheus:9090"]
    loki["Loki"]
    tempo["Tempo:4317"]
    pyroscope["Pyroscope:4040"]

    %% Gateway → backends
    otel_recv -- "metrics" --> prometheus
    scraper -- "metrics\n(remote write)" --> prometheus
    otel_recv -- "logs (OTLP)" --> loki
    otel_recv -- "traces (OTLP)" --> tempo
    sdk_prof -- "profiles" --> pyroscope

    %% Collector → backends
    log_scrape -- "logs" --> loki
    ebpf_prof -- "profiles" --> pyroscope

    %% Metrics from Traces
    tempo -- "Span metrics generator\n(RED metrics: rate, errors, duration)" --> prometheus

    mimir["Mimir\n(long-term metrics)"]

    prometheus -- "remote write" --> mimir

    mimir --> grafana
    grafana["Grafana :3000"]

    prometheus --> grafana
    loki --> grafana
    tempo --> grafana
    pyroscope --> grafana

    %% Styling
    style alloy_gw fill:#f59e0b,stroke:#d97706,color:#000
    style alloy_col fill:#fbbf24,stroke:#d97706,color:#000

    style sources fill:#e5e7eb,stroke:#9ca3af,color:#000

    style grafana fill:#10b981,stroke:#059669,color:#fff
    style prometheus fill:#3b82f6,stroke:#2563eb,color:#fff
    style loki fill:#3b82f6,stroke:#2563eb,color:#fff
    style tempo fill:#3b82f6,stroke:#2563eb,color:#fff
    style pyroscope fill:#3b82f6,stroke:#2563eb,color:#fff
    style mimir fill:#3b82f6,stroke:#2563eb,color:#fff
Two Alloy releases: cluster-scoped work (OTLP receiving, Prometheus scraping, SDK profile pulling) runs on the horizontally-scaled
alloyDeployment with HPA + clustering. Node-scoped work (pod log tailing, eBPF profiling) runs on thealloy-collectorDaemonSet because it needs host filesystem and kernel access. Producers continue to use the unchangedalloy.monitoring:4317/4318service name; the K8s Service round-robins OTLP connections across gateway replicas.
Key Flows
1. Metrics — The gateway scrapes metrics from both applications (ServiceMonitors, pod annotations) and Kubernetes components (kube-state-metrics, node-exporter, kubelet, PostgreSQL/Redis exporters) and sends them to Prometheus via remote write. Scrape targets are sharded across gateway replicas via Alloy clustering — each target is owned by exactly one replica, so scaling out splits the load instead of duplicating it.
2. Logs — Application OTLP logs (structured, with trace context) are received by the gateway. Pod stdout/stderr logs are tailed from /var/log/pods by the collector DaemonSet (one pod per node, each handling only its own node’s logs). Both streams go to Loki.
3. Profiles — Two paths: SDK-instrumented services expose /debug/pprof and are scraped by the gateway (sharded). All other processes — including those with no instrumentation — are profiled by the collector DaemonSet’s eBPF probe (97 Hz kernel sampling). Both feed Pyroscope.
4. Metrics from Traces — Tempo automatically generates RED metrics (Rate, Errors, Duration) from spans using the built-in span metrics generator and sends them back to Prometheus. This allows creating alerts and dashboards based on traces without manual metric instrumentation.
🧱 OpenTelemetry Collector
The Collector is a service that sits between applications and observability backends.
Application → OTel SDK → OTel Collector → Grafana / Tempo / Prometheus / Loki
⚙️ Collector Architecture
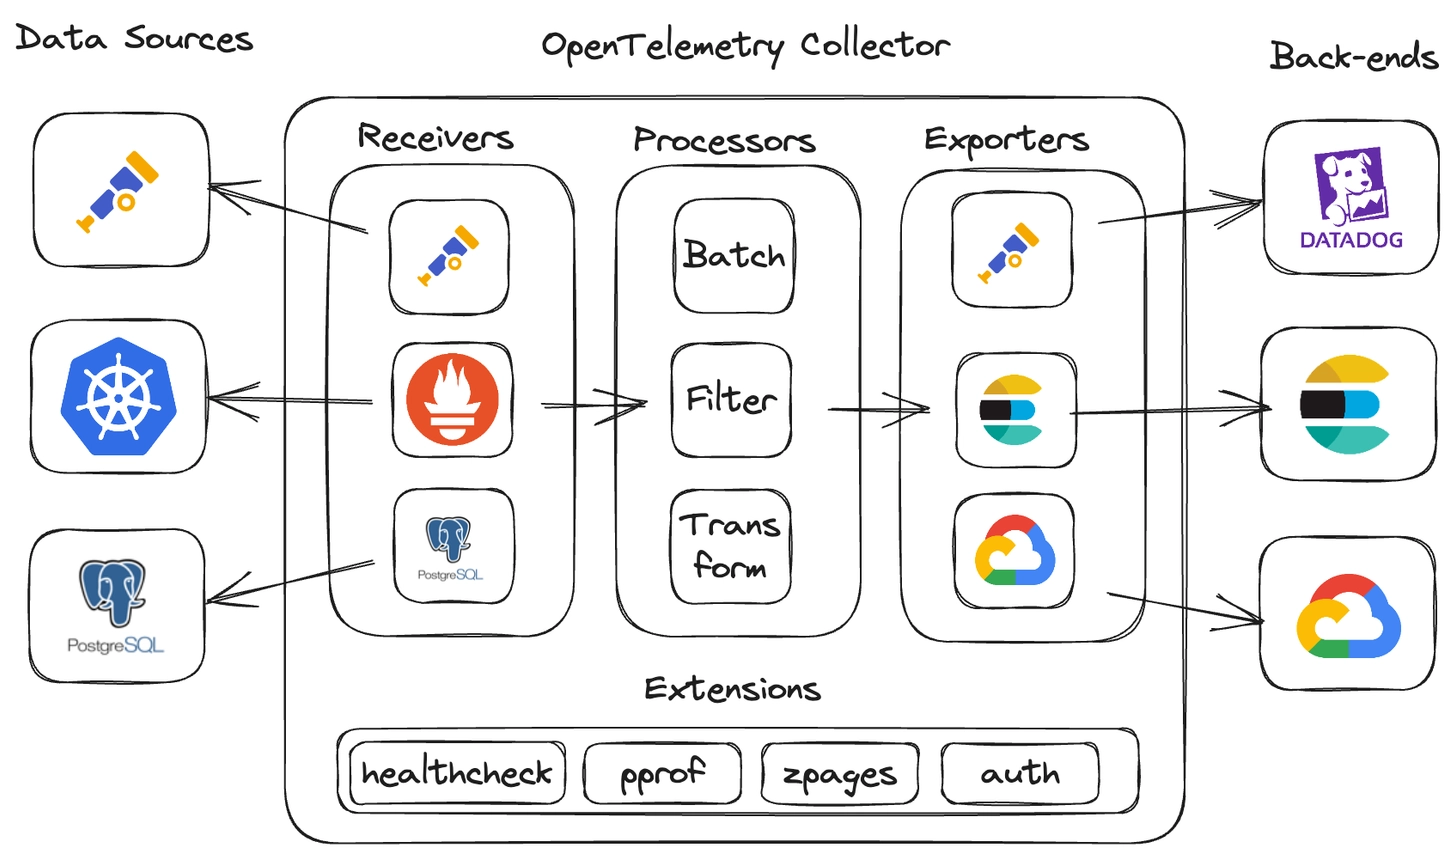
The Collector consists of 3 key parts:
| Component | Role |
|---|---|
| Receivers | receive data (OTLP, Jaeger, Prometheus, Zipkin) |
| Processors | process data (batch, sampling, transformations) |
| Exporters | send data to backends |
🧭 Collector Deployment Modes
| Mode | Description | Example Use Case |
|---|---|---|
| Agent mode | collector running locally on a node | collecting data from a single host |
| Gateway mode | central collector gathering data from multiple sources | scaled environments |
| Hybrid mode | combination of both approaches | large distributed systems |
🔄 Grafana Alloy vs OpenTelemetry Collector
Grafana Alloy (formerly Grafana Agent) and OpenTelemetry Collector serve a similar role — they collect, process, and forward telemetry data. However, they differ in philosophy and ecosystem.
| Feature | OpenTelemetry Collector | Grafana Alloy |
|---|---|---|
| Project | CNCF (vendor-neutral) | Grafana Labs (open source) |
| Configuration | YAML (pipelines: receivers → processors → exporters) | River (HCL-like, declarative, with typing) |
| Signals | Traces, Metrics, Logs | Traces, Metrics, Logs, Profiles (Pyroscope) |
| Prometheus Scraping | Yes (receiver prometheus) |
Native — full compatibility with prometheus.scrape |
| Grafana Stack Integration | Requires exporter configuration | Out-of-the-box (Loki, Tempo, Mimir, Pyroscope) |
| Debug UI | None (CLI/logs) | Built-in UI with component graph (localhost:12345) |
| Clustering | None (requires external load balancer) | Built-in — automatic target sharding between instances |
| Distributions | otelcol-core, otelcol-contrib, custom builder (ocb) |
Single binary — all components in one |
| Config conversion | — | alloy convert — automatic migration from OTel Collector, Prometheus, Promtail |
When to choose OTel Collector?
- Multi-vendor environment — data goes to different backends (Datadog, Jaeger, Elastic, Grafana)
- You want to stay with the CNCF standard without vendor lock-in
- You need custom builds with selected components (
ocb)
When to choose Grafana Alloy?
- Stack based on Grafana (Loki, Tempo, Mimir, Pyroscope)
- You need profiling (native Pyroscope integration)
- You want clustering and automatic target sharding without external tools
- You prefer declarative configuration (River) over YAML pipelines
Example — the same pipeline in both tools
OpenTelemetry Collector (YAML):
receivers:
  otlp:
    protocols:
      grpc:
        endpoint: "0.0.0.0:4317"

processors:
  batch:
    timeout: 5s

exporters:
  otlp:
    endpoint: "tempo:4317"
    tls:
      insecure: true

service:
  pipelines:
    traces:
      receivers: [otlp]
      processors: [batch]
      exporters: [otlp]
Grafana Alloy (River):
otelcol.receiver.otlp "default" {
  grpc {
    endpoint = "0.0.0.0:4317"
  }
  output {
    traces = [otelcol.processor.batch.default.input]
  }
}

otelcol.processor.batch "default" {
  timeout = "5s"
  output {
    traces = [otelcol.exporter.otlp.tempo.input]
  }
}

otelcol.exporter.otlp "tempo" {
  client {
    endpoint = "tempo:4317"
    tls {
      insecure = true
    }
  }
}
4️⃣ Instrumentation Methods
🎯 Instrumentation Goal
Collecting telemetry data from applications in an automatic or manual way, to have a complete picture of system behavior.
🧰 1. Application Instrumentation (Manual)
- You add code to the application (
@WithSpan,Tracer.startSpan(), etc.) - Most of the heavy lifting is done by libraries.
- ✅ Advantages:
- full control
- precise data
- ❌ Disadvantages:
- time-consuming
- requires code maintenance
# Install NuGet packages
dotnet add package OpenTelemetry.Extensions.Hosting
dotnet add package OpenTelemetry.Instrumentation.AspNetCore
dotnet add package OpenTelemetry.Instrumentation.Http
dotnet add package OpenTelemetry.Exporter.OpenTelemetryProtocol
// Program.cs
var builder = WebApplication.CreateBuilder(args);

builder.Services.AddOpenTelemetry()
    .WithTracing(builder => builder
        .AddAspNetCoreInstrumentation()
        .AddHttpClientInstrumentation()
        .AddOtlpExporter(options =>
        {
            options.Endpoint = new Uri("http://otel-collector:4318");
        }));

var app = builder.Build();
⚙️ 2. Auto-Instrumentation
- Language agent that automatically tracks calls (e.g., HTTP, DB, Kafka)
- ✅ Advantages:
- quick start
- no code changes
- ❌ Disadvantages:
- limited flexibility
- framework-dependent
Example for Java:
# 1. Download OpenTelemetry Java Agent
wget -O opentelemetry-javaagent.jar \
  https://github.com/open-telemetry/opentelemetry-java-instrumentation/releases/latest/download/opentelemetry-javaagent.jar

# 2. Run application with agent
java -javaagent:opentelemetry-javaagent.jar \
  -Dotel.service.name=my-java-app \
  -Dotel.exporter.otlp.endpoint=http://otel-collector:4318 \
  -Dotel.exporter.otlp.protocol=http/protobuf \
  -jar my-application.jar
Java auto-instrumentation covers:
- HTTP clients/servers (OkHttp, Apache HttpClient, Spring WebMVC)
- Database drivers (JDBC, MongoDB, Redis)
- Messaging (Kafka, RabbitMQ, JMS)
- Frameworks (Spring Boot, Quarkus, Micronaut)
Example for .NET:
# 1. Install OpenTelemetry .NET Automatic Instrumentation
# Download and install from GitHub releases
wget -O otel-dotnet-auto-install.sh \
  https://github.com/open-telemetry/opentelemetry-dotnet-instrumentation/releases/latest/download/otel-dotnet-auto-install.sh
chmod +x otel-dotnet-auto-install.sh
./otel-dotnet-auto-install.sh

# 2. Set environment variables
export CORECLR_ENABLE_PROFILING=1
export CORECLR_PROFILER={918728DD-259F-4A6A-AC2B-B85E1B658318}
export CORECLR_PROFILER_PATH=/opt/opentelemetry/OpenTelemetry.AutoInstrumentation.Native.so
export DOTNET_ADDITIONAL_DEPS=/opt/opentelemetry/AdditionalDeps
export DOTNET_SHARED_STORE=/opt/opentelemetry/store
export DOTNET_STARTUP_HOOKS=/opt/opentelemetry/net/OpenTelemetry.AutoInstrumentation.StartupHook.dll
export OTEL_DOTNET_AUTO_HOME=/opt/opentelemetry

# 3. Configure OpenTelemetry
export OTEL_SERVICE_NAME=my-dotnet-app
export OTEL_EXPORTER_OTLP_ENDPOINT=http://otel-collector:4318
export OTEL_EXPORTER_OTLP_PROTOCOL=http/protobuf

# 4. Run the application
dotnet MyApplication.dll
NET auto-instrumentation covers:
- HTTP clients/servers (HttpClient, ASP.NET Core)
- Database providers (Entity Framework, SqlClient, MongoDB)
- Messaging (Azure Service Bus, RabbitMQ, Kafka)
- gRPC clients/servers
🧱 3. OBI – OpenTelemetry Binary Instrumentation
- Ready-made binary or sidecar that intercepts telemetry data
- ✅ Advantages:
- ideal for legacy systems
- quick deployment
- ❌ Disadvantages:
- less control
- harder debugging

🧩 Integration with Grafana Stack
- Prometheus / Mimir → metrics
- Loki → logs
- Tempo → traces
- Grafana → visualization and data correlation
📦 Collector in Kubernetes
- Deployed as:
- DaemonSet – one agent per node
- Sidecar – alongside the application
- Deployment – in gateway mode
- Configuration in YAML (receivers, processors, exporters)
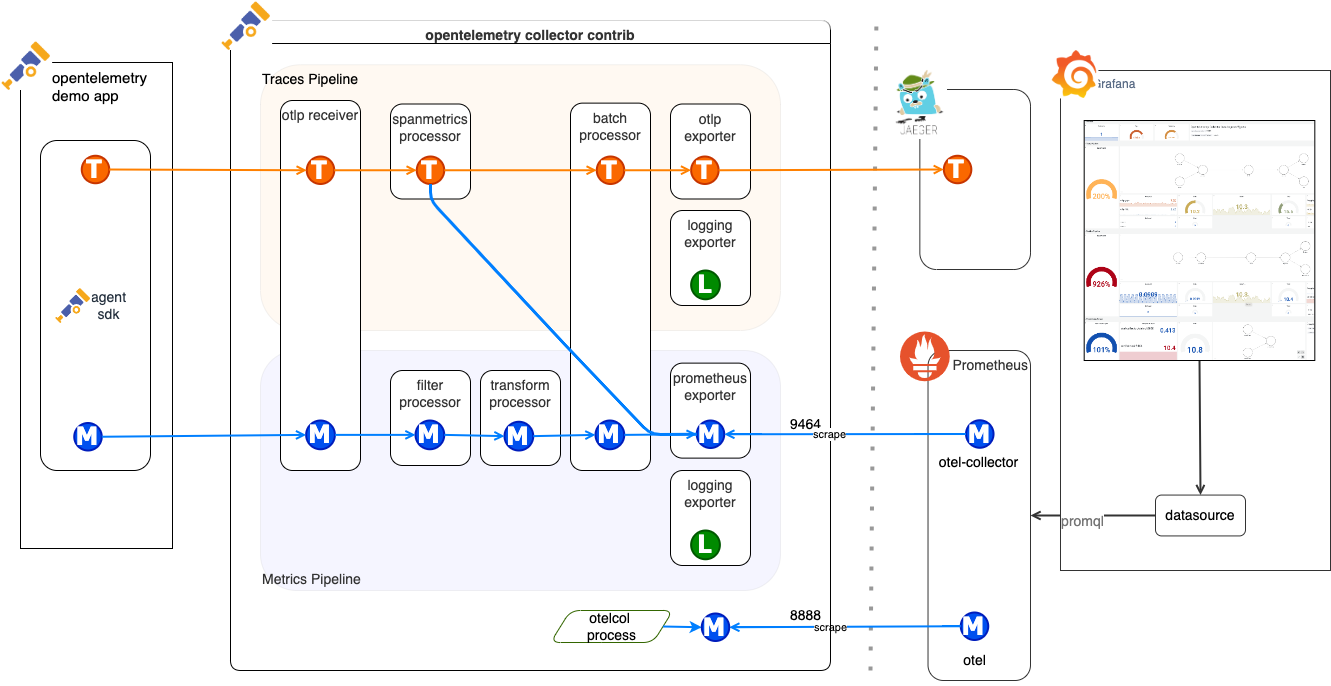
🔬 OpenTelemetry in Practice — Demo Application
The demo application at github.com/ProtopiaTech/opentelemetry-demo shows how real services are instrumented with OpenTelemetry. Three services demonstrate three distinct integration patterns.
Pattern 1: Manual SDK Setup (Go)
Service: src/product-catalog (gRPC service)
| What to look at | Where |
|---|---|
| SDK initialization (TracerProvider, MeterProvider, LoggerProvider) | main.go — main() function |
| OTLP gRPC exporter configuration | main.go — provider setup |
| gRPC auto-instrumentation | otelgrpc.NewServerHandler(), otelgrpc.NewClientHandler() |
| Custom span attributes | app.product.id, app.product.name, app.products.count |
| Structured logging via OTel | otelslog bridge — logs carry trace context automatically |
| Runtime metrics | runtime.Start() for Go runtime statistics |
Key takeaway: In Go, you initialize providers explicitly and wire them into gRPC server/client options. Auto-instrumentation handles the span lifecycle; you add custom attributes for business context.
Pattern 2: Auto-Instrumentation (Python)
Service: src/recommendation (gRPC service)
| What to look at | Where |
|---|---|
| Auto-instrumentation setup | Dockerfile — entrypoint uses opentelemetry-instrument |
| Dependencies | requirements.txt — opentelemetry-distro, opentelemetry-bootstrap |
| Custom metric (counter) | recommendation_server.py — app_recommendations_counter |
| Manual spans alongside auto-instrumentation | tracer.start_as_current_span("get_product_list") |
| Log trace context injection | logger.py — custom JSON formatter injects trace/span IDs |
Key takeaway: Python auto-instrumentation requires zero code changes for HTTP, gRPC, and DB calls. You add the opentelemetry-instrument wrapper at startup and get spans automatically. Custom counters and manual spans are added on top for business-specific telemetry.
Pattern 3: Explicit Instrumentors + Baggage (Python)
Service: src/load-generator (Locust-based)
| What to look at | Where |
|---|---|
| Manual SDK init with explicit instrumentors | locustfile.py — Jinja2Instrumentor, RequestsInstrumentor, URLLib3Instrumentor |
| Baggage propagation | session.id, synthetic_request — carried across service boundaries |
| Per-task manual spans | user_browse_product, user_checkout_single, etc. with business attributes |
| System metrics collection | SystemMetricsInstrumentor for host-level metrics |
Key takeaway: When auto-instrumentation doesn’t cover your framework (Locust), you instantiate specific instrumentors manually. Baggage lets you attach metadata (e.g., session ID, synthetic flag) that propagates through the entire request chain.
What You Get for Free vs What You Add
| Auto-instrumentation (free) | Manual additions | |
|---|---|---|
| Traces | HTTP/gRPC spans, DB query spans, messaging spans | Custom spans for business operations, extra attributes (product.id, user.id) |
| Metrics | Runtime metrics (GC, goroutines, threads), HTTP request duration/count | Custom counters and histograms for business KPIs |
| Logs | Trace context injection (trace ID, span ID in every log line) | Structured fields, custom log levels, business event logs |
The Export Flow
All three services follow the same pattern:
Application (OTel SDK)
    → OTLP gRPC :4317
        → Grafana Alloy (Collector)
            → Prometheus (metrics)
            → Loki (logs)
            → Tempo (traces)
            → Pyroscope (profiles)
Key Environment Variables
Every OTel-instrumented service is configured via environment variables — no vendor-specific code needed:
| Variable | Purpose | Example |
|---|---|---|
OTEL_SERVICE_NAME |
Identifies the service in traces/metrics | product-catalog |
OTEL_EXPORTER_OTLP_ENDPOINT |
Where to send telemetry | http://alloy:4317 |
OTEL_EXPORTER_OTLP_PROTOCOL |
Wire protocol | grpc or http/protobuf |
OTEL_TRACES_SAMPLER |
Sampling strategy | parentbased_traceidratio |
OTEL_TRACES_SAMPLER_ARG |
Sampling rate | 0.1 (10%) |
OTEL_RESOURCE_ATTRIBUTES |
Extra resource attributes | deployment.environment=production |
OTEL_LOGS_EXPORTER |
Log exporter type | otlp |
OTEL_METRICS_EXPORTER |
Metrics exporter type | otlp |
These variables are standardized by the OTel specification. They work the same way regardless of language or backend.
📚 Additional Resources
- https://opentelemetry.io – official documentation
- https://github.com/ProtopiaTech/opentelemetry-demo – demo application with full instrumentation
- https://grafana.com/oss/opentelemetry/
- https://github.com/open-telemetry/opentelemetry-collector
- https://opentelemetry.io/docs/concepts/