How Pixie Uses eBPF
Source: https://docs.px.dev/about-pixie/pixie-ebpf/
Pixie uses eBPF (extended Berkeley Packet Filter) to collect telemetry data directly from the Linux kernel — no code changes, no sidecars, no redeployments.
Protocol Tracing
Pixie deploys kprobes on Linux syscalls used for networking (send(), recv(), write(), read()). When an application makes a network call, the eBPF probe triggers, intercepts the raw data, and sends it to the PEM (Pixie Edge Module) for protocol parsing and storage.

Encrypted Traffic (TLS/SSL)
For encrypted connections, kprobes alone would only see ciphertext. Pixie solves this by attaching uprobes to encryption library function calls (e.g., SSL_write, SSL_read) to capture data before encryption or after decryption. No decryption keys or certificates are needed.

Supported encryption libraries:
- OpenSSL 1.1.0, 1.1.1, 3.x (dynamically linked)
- Go TLS (standard + boringcrypto, requires debug info)
- BoringSSL
CPU Profiling
Pixie’s continuous profiler uses sampling-based eBPF that periodically interrupts the CPU (~every 10ms / 100 Hz) to collect stack traces. This identifies CPU-intensive code paths with negligible overhead.
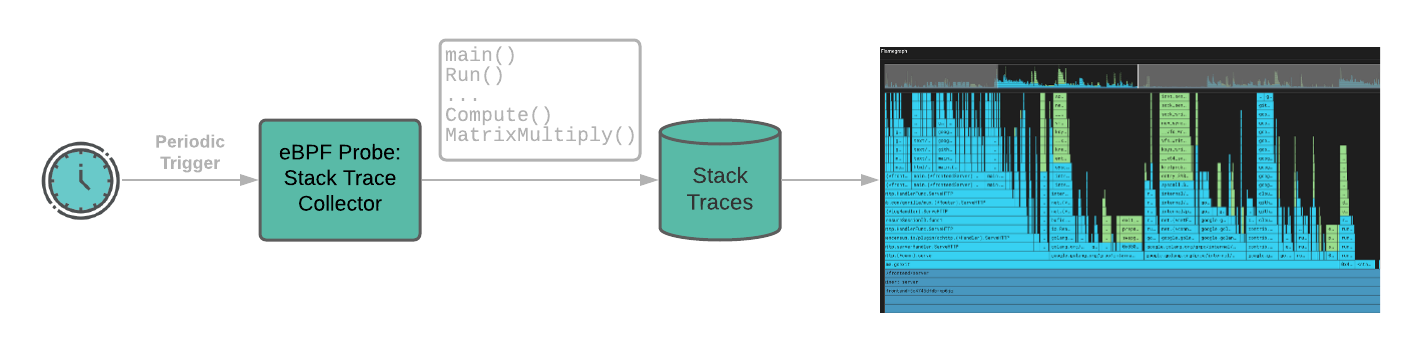
Supported languages for profiling: Go, C++, Rust and other compiled languages.
Custom eBPF with bpftrace
Pixie supports deploying distributed bpftrace scripts across the cluster. This allows custom eBPF probes for use cases not covered by built-in tracing — Pixie orchestrates deployment and collects results into structured data tables queryable via PxL.
Probe Types Summary
| Probe Type | Target | Purpose |
|---|---|---|
| kprobes | Linux syscalls (send(), recv(), etc.) |
Capture network I/O at the kernel level |
| uprobes | Encryption libraries (OpenSSL, GoTLS, BoringSSL) | Intercept data before encryption to trace TLS traffic |
| Sampling profiler | CPU interrupts (~every 10ms) | Collect stack traces for continuous CPU profiling |
| bpftrace | Custom user-defined probes | Deploy custom eBPF scripts across the cluster |
Performance Overhead
The eBPF-based approach has negligible overhead because:
- Probes run in kernel space with minimal context switching
- CPU profiling uses low-frequency sampling (~100 Hz)
- No data leaves the node unless queried