Drilldown apps
- Plugins, installation and versions
- Metrics Drilldown
- Logs Drilldown
- Traces Drilldown
- Profiles Drilldown
- Shop copies in the lab
- Working model
- Related lessons
The four Drilldown apps explore metrics, logs, traces and profiles without writing queries: click a label, filter, break down, and finish with a generated query in Explore. For the administrator they are four plugins that install themselves, change versions without asking and have specific requirements on the backends.
Plugins, installation and versions
| App | Plugin ID | Version in the workshop lab |
|---|---|---|
| Metrics Drilldown | grafana-metricsdrilldown-app |
2.5.1 |
| Logs Drilldown | grafana-lokiexplore-app |
2.6.0 |
| Traces Drilldown | grafana-exploretraces-app |
2.2.1 |
| Profiles Drilldown | grafana-pyroscope-app |
2.2.0 (pinned) |
- Preinstalled, but not in the image. The Grafana image ships the built-in datasources, not the Drilldown apps. Grafana downloads the apps from grafana.com at startup (
[plugins] preinstall, in the background). Without access to the catalog the Drilldown menu is empty. preinstall_auto_update = true(default) bumps unpinned apps on every restart to the newest version within the same major version (a new major is skipped). The UI changes between workshops and between environments. In the lab the Helm chart setspreinstall_auto_update = false, but/var/lib/grafanais anemptyDir, so every new pod installs unpinned apps from scratch in the newest version — the table above is the state on the day of verification.- Pinning
id@version:- in
preinstall— Grafana enforces that version at startup and blocks Update / Uninstall in the UI (HTTP 409); without a version it blocks only Uninstall; - in
preinstall_sync— installed before startup, but the UI is not locked: a server administrator (Grafana Admin) can update the plugin, and a restart restores the pin. In the lab theplugins:list from the Helm chart values goes toGF_PLUGINS_PREINSTALL_SYNC(Install plugins using the Grafana Helm chart), sografana-pyroscope-app@2.2.0is protected only until the next change in the UI. - Details, including
preinstall_syncerrors that stop startup: Plugin management.
- in
- Disabling:
preinstall_disabled = trueturns off all preinstallation;disable_plugins = <id>removes the plugin from preinstallation and prevents it from loading. - Checking the version:
GET /api/plugins/<id>/settings→.info.version, or Administration → Plugins and data → Plugins (Manage your plugins). - Permissions: the same as Explore (
datasources:explore; Permissions).
Metrics Drilldown
Docs: Drill down your metrics.
- Metric list with prefix / suffix filters, rules and labels; Select opens a metric.
- Metric tabs: Breakdown (a breakdown by every label), Related metrics, Related logs, Query results.
- Related logs searches Loki by the labels in the filters. It returns results only when every filter label exists in Loki:
service_namepasses,span_kindfrom span metrics zeroes the tab without a message. - Panel menu → Explore gives ready PromQL (View the metric in Explore).
The metric traces_spanmetrics_calls_total in Metrics Drilldown in the workshop lab (Prometheus datasource, last hour), Breakdown tab:
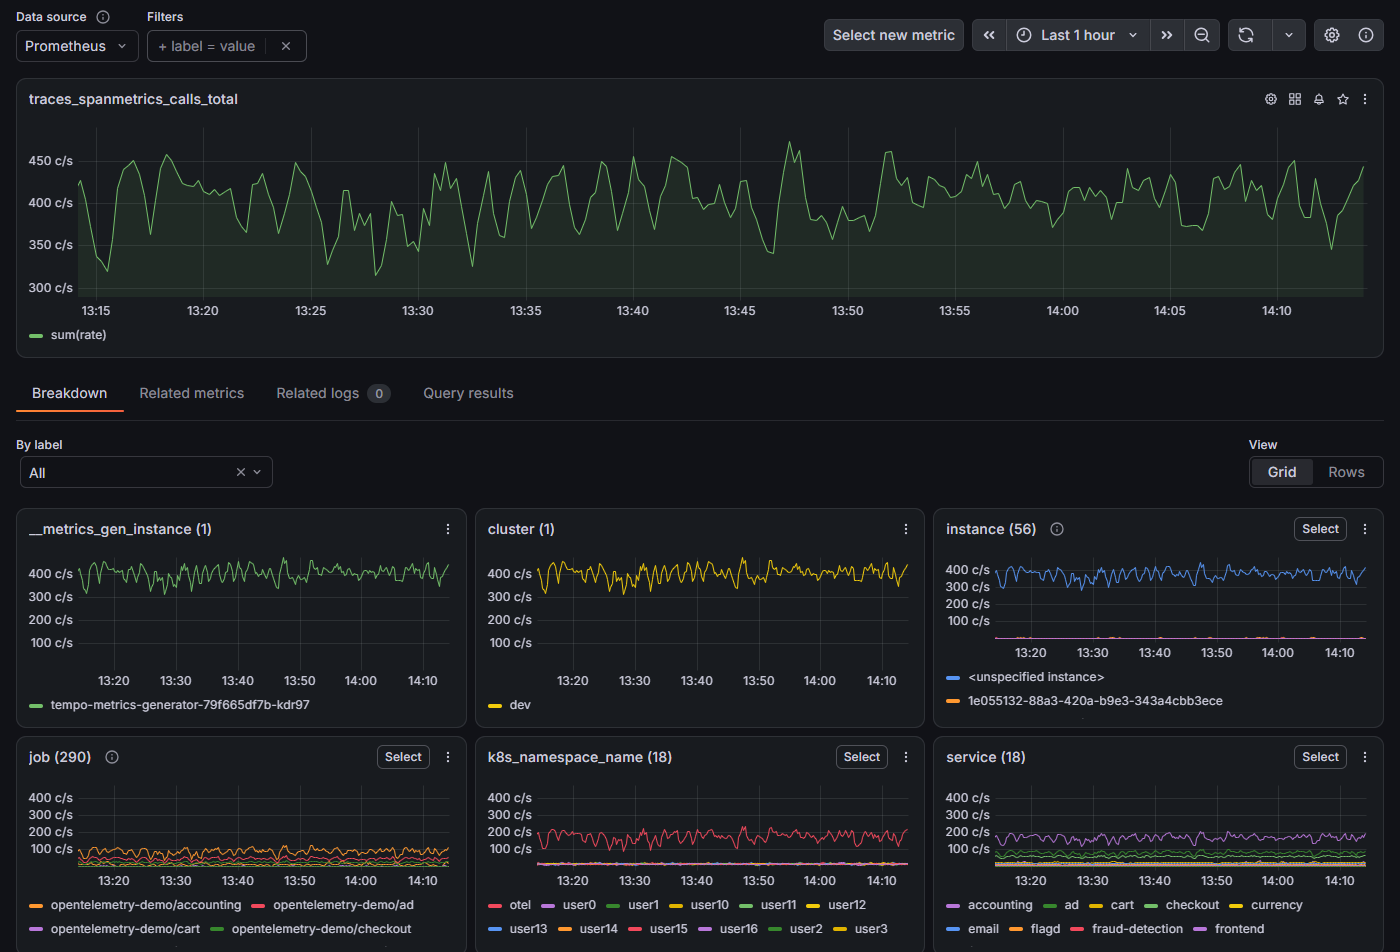
- Data source and Filters — the datasource and
label = valuefilters. Select new metric returns to the metric list. - Metric graph — the app picks the function itself: a counter is shown as
sum(rate). - Tabs — Breakdown, Related metrics, Related logs (with the number of results found), Query results.
- Breakdown tiles — one per label, with the number of values in brackets.
k8s_namespace_nameis the shopoteland its copiesuserN(section Shop copies in the lab below). Select on a tile breaks the graph down by that label’s values.
Logs Drilldown
- Requirements (Enable in Loki configuration): Loki ≥ 3.2, the
service_namelabel (Loki derives it at write time if missing),pattern_ingester.enabled: truefor patterns (defaultfalse). The other required Loki settings (allow_structured_metadata,volume_enabled,discover_log_levels) default totrue— check that nobody turned them off. - Service list → Show logs. Tabs: Logs, Labels, Fields, Patterns. Labels also includes
detected_level; Select on a label shows its value distribution, Include / Exclude adds a filter. - Fields are fields detected in the line body (JSON, logfmt), flattened to underscore names:
attributes.err.messagefrom an OTLP line becomesattributes_err_message. A filter on a field means parsers (| json | logfmt) in the generated LogQL, so it costs more than a label filter. - Patterns come from the pattern ingester. For JSON lines the ingester tokenizes only the fields in
pattern_ingester_tokenizable_json_fields_default(log,message,msg,msg_,_msg,content). OTLP logs with their content inbodygive zero patterns until you addbodythroughpattern_ingester_tokenizable_json_fields_append. Patterns live in ingester memory (3 h; Patterns are only available for the most recent 3 hours of data). - Plugin settings (Configuration tab): Default data source, Default time range, Maximum time picker interval, Disable Loki patterns. An organization Admin changes them, and they apply to all users.
- Panel menu → Explore gives LogQL with the selector and filters from the app.
The payment service in Logs Drilldown (filters service_name = payment and namespace = otel, last hour), Fields tab:
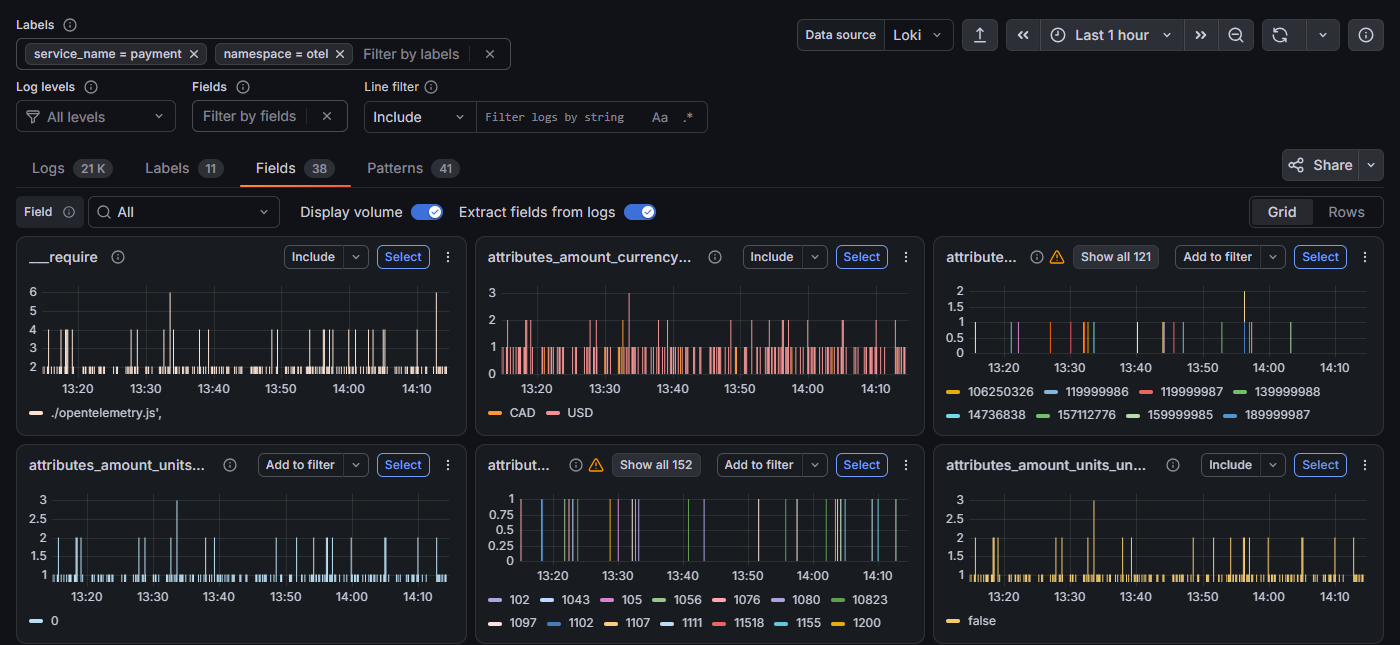
- Labels — stream label filters. Below them the Log levels, Fields and Line filter (text or regex) filters.
- Tabs with counters — number of lines (Logs), labels, detected fields and patterns.
- Field tiles — fields from the JSON line after flattening:
attributes_cardType,attributes_loyalty_level,attributes_amount_currency_code. Each tile shows line volume split by the field’s values. - Include / Add to filter and Select — the first adds a filter on the field (a parser in LogQL), Select opens the value distribution.
Traces Drilldown
- Requirement: TraceQL metrics. Tempo needs the
local-blocksprocessor in the metrics-generator (in the lablocal_blockswithfilter_server_spans: false). Without it the RED graphs fail (localblocks processor not found). - Span type (Choose root or full span data): the Root spans / All spans switch and the menu next to it with Server spans, Consumer spans, Database calls. A server span that is never the root of a trace (e.g.
Chargeinpayment) does not appear under Root spans: the service shows only its background spans (tcp.connect,dns.lookup), without call errors. All spans is the heaviest query variant. - RED metric (Choose a RED metric): Rate, Errors, Duration — chosen by clicking a graph (Span rate, Errors rate, Duration).
-
Tabs (Analyze tracing data) depend on the metric. Breakdown (by attribute) and Comparison (selection attributes vs baseline, TraceQL
compare()) are always there. Then:Metric Trace structure Others Rate Service structure Traces Errors Root cause errors Exceptions, Errored traces Duration Root cause latency Slow traces - Root cause errors with several faults at once shows a separate structure for every entry service. A filter on an intermediate service (e.g.
checkout) extracts one chain. - Comparison points to attributes that occur only in the selection — for errors usually attributes the instrumentation added with the exception (
grpc.error_message), not the business cause. - Panel menu → Explore gives a TraceQL metrics query with the filters from the app.
Traces Drilldown in the workshop lab, last hour, Root spans, Span rate metric:
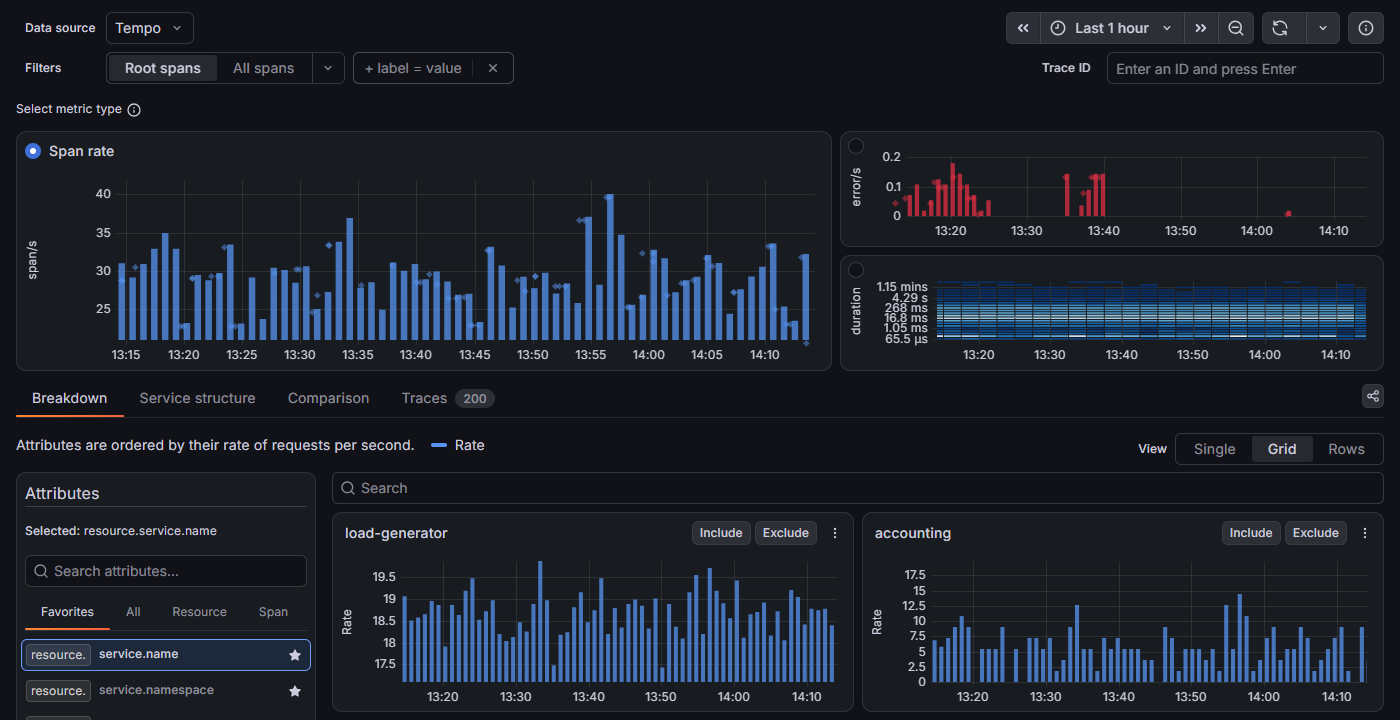
- Filters — the Root spans / All spans switch with a menu of further types, then
label = valuefilters. On the right, the Trace ID field. - Select metric type — three RED graphs: Span rate, errors (
error/s) and a duration heatmap. The radio button in the graph corner selects the metric. - Tabs for Rate — Breakdown, Service structure, Comparison and Traces with the number of traces in the list.
- Breakdown — attribute list on the left (Favorites, All, Resource, Span),
resource.service.nameby default. On the right a tile per value, with Include / Exclude.
Profiles Drilldown
Docs: Choose a view.
- All services → service → Flame graph, Diff flame graph (baseline vs comparison from two selected windows).
- Pick the profile type above the list. The set of types depends on the SDK: Go and Java have CPU, Node.js in the lab only
wallandmemory. - In the lab, services profiled by the SDK are named
<namespace>.<service>(otel.payment, in shop copiesuser3.payment), and those profiled by eBPF<service>(valkey-cart). A service with an SDK has no second series from eBPF. - Explain flame graph needs
grafana-llm-appand an external LLM provider — the exercises do not rely on it.
The otel.checkout service (Go, profiled by the SDK) in Profiles Drilldown, type process_cpu/cpu, Flame graph tab:
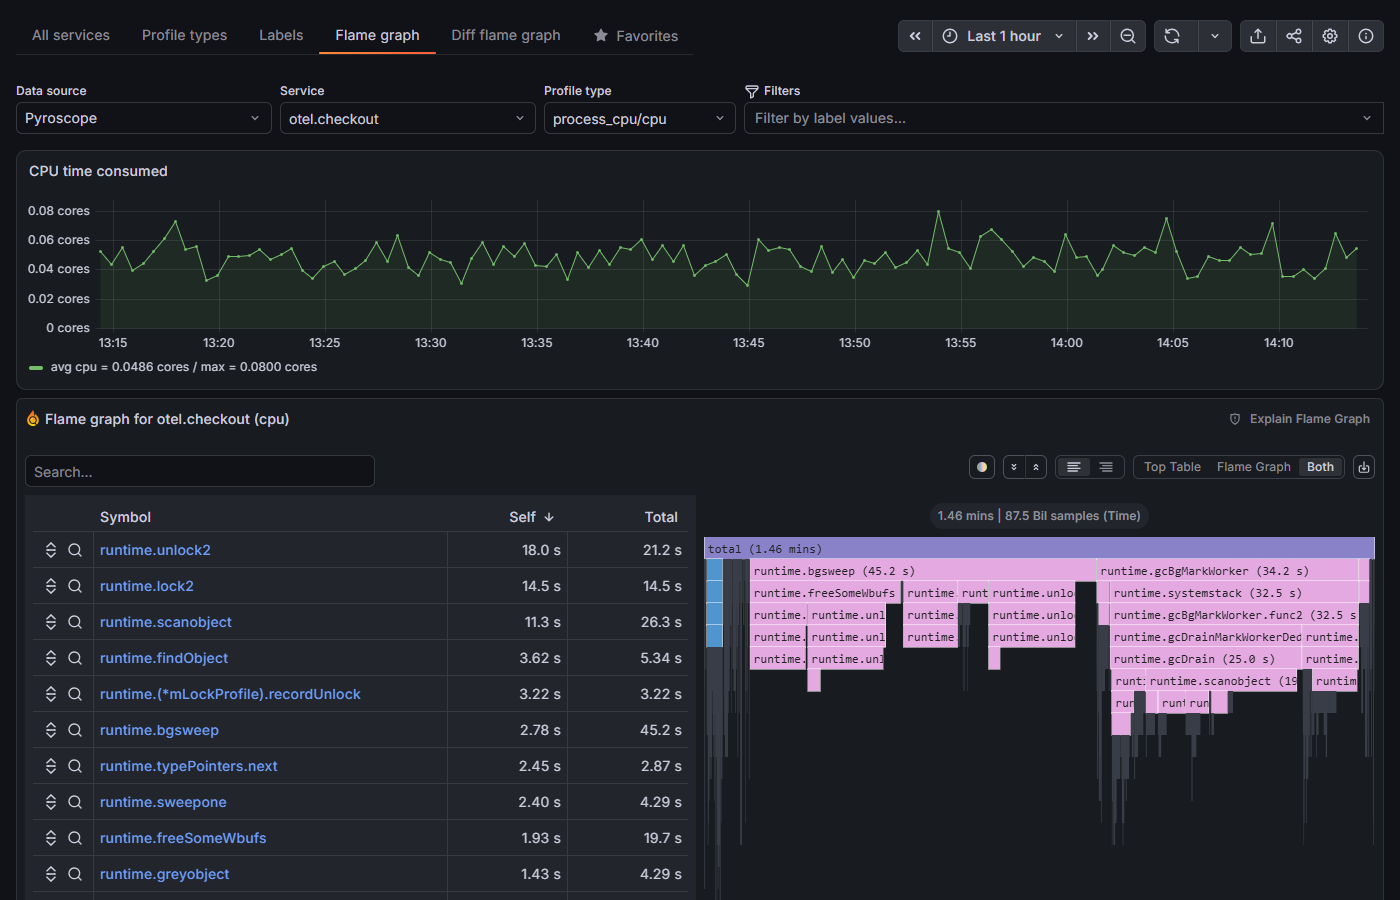
- Service and Profile type — the service with the namespace prefix (
otel.checkout) and a profile type its SDK provides. - CPU time consumed — the service’s CPU use in cores, over time.
- Top Table / Flame Graph / Both — the symbol table with Self (the function alone) and Total (with callees) next to the flame graph. Frame width is the share of samples.
- Explain Flame Graph — a button in the flame graph header, described in the bullet above.
Shop copies in the lab
Besides the shop in namespace otel, the lab runs copies of it in userN namespaces (the SRE agent lab) with the same service names. service_name alone does not identify one service. You filter by namespace with a label that has a different name in every signal:
| Signal | Namespace |
|---|---|
| Loki | label namespace |
| Prometheus (span metrics) | label k8s_namespace_name |
| Tempo | attribute resource.k8s.namespace.name |
| Pyroscope | prefix in service_name (otel.payment) |
Working model
%%{init: {"flowchart": {"curve": "basis", "nodeSpacing": 22, "rankSpacing": 45, "padding": 12}, "themeVariables": {"fontSize": "15px", "lineColor": "#8a93a3", "edgeLabelBackground": "#ffffff"}}}%%
flowchart LR
  A("<b>Drilldown</b><br/>symptom") --> B("<b>Filter and breakdown</b><br/>by label")
  B --> C("<b>Explore</b><br/>panel menu")
  C --> D("<b>Dashboard panel</b>")
  C --> E("<b>Alert rule</b>")

  classDef blue fill:#e8f0fc,stroke:#2f6fde,stroke-width:2px,color:#1b1f27
  classDef green fill:#e3f4ee,stroke:#0f9d76,stroke-width:2px,color:#1b1f27
  classDef orange fill:#fbefe3,stroke:#d9822b,stroke-width:2px,color:#1b1f27
  class A,B blue
  class C green
  class D,E orange

  click A href "https://grafana.com/docs/grafana/latest/explore/simplified-exploration/"
  click C href "https://grafana.com/docs/grafana/latest/explore/"
Drilldown generates queries but does not own them: whatever must outlive the incident goes from Explore to a dashboard or an alert rule (Grafana).
💪Exercise💪 (self-guided): Payment incident in Drilldown —
paymentFailurealongside several other faults: from metrics through logs to a trace, the source service from Root cause errors, the slowest operation from Duration, three generated queries, two of them on a dashboard.💪Exercise💪 🤖 (self-guided): Payment incident with an AI agent — the same incident diagnosed by an agent from the symptom alone, every conclusion checked in Drilldown.
Related lessons
- Logs, traces and datasource links
- Explore
- LogQL — the queries Logs Drilldown generates
- Integrations & TraceQL — TraceQL and TraceQL metrics behind Traces Drilldown
- Flame graphs — reading what Profiles Drilldown shows
- Grafana — plugins and configuration of the lab’s Grafana