Explore
- Explore toolbar
- Access and configuration
- Query history
- The Explore URL as an interface
- Query inspector — the diagnostic tool
- Related lessons
Explore is the place for ad hoc queries without building a dashboard. An administrator owns three things in it: who has access, what Grafana stores about users’ queries, and why the same PromQL gives different numbers in a panel and in Explore.
Explore toolbar
Documentation: Explore elements.
Explore in the workshop lab, Prometheus datasource, call rate of the payment service over the last hour:
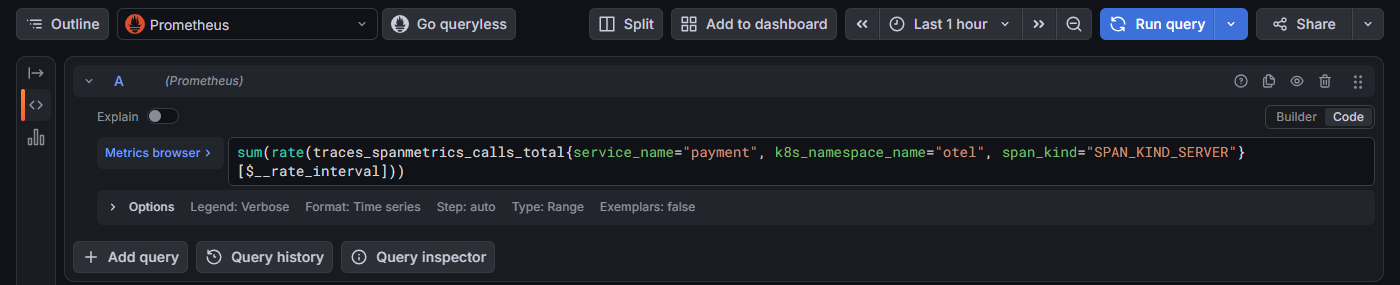
- Bar above the query — the elements from the table below, left to right. Instead of the Add menu there is a single Add to dashboard button: the lab’s anonymous Editor has no
datasources:write, so no Add correlation item either. - Query editor — Builder / Code toggle on the right; under the query, collapsed Options with a summary (
Step: auto,Type: Range,Exemplars: false). - Query history and Query inspector — buttons under the query, described in the sections below.
| Element | What it does | Admin notes |
|---|---|---|
| Outline | list of queries and result panels (content outline) | useful with many queries and split view |
| Go queryless | jumps to the Drilldown app for the current datasource | lesson 06 |
| Split | a second pane next to the first, with any datasource | both panes’ time is synced right away (chain icon Synced times); clicking the icon unsyncs them |
| Add → Add to dashboard | panel from the current queries on a new or existing dashboard | Explore doesn’t save the dashboard, you do; the same menu holds Add correlation (Correlations) |
| Share | Copy shortened URL → /goto/<uid>; the menu has Copy URL, Copy absolute shortened URL, Copy absolute URL |
the absolute variant replaces now-1h with fixed timestamps (Share shortened links with absolute time) |
The query editor has Builder and Code modes. Besides plugin datasources, Explore supports the special -- Grafana -- (random walk, Live measurements, public files) and -- Mixed -- (queries to several datasources at once; their parallelism is capped by [query] concurrent_query_limit, by default the number of CPUs). -- Dashboard -- works only in panels.
After Split — the split view from exercise 02: the same metric on the left, payment logs from Loki on the right (stream="otel", info level only):
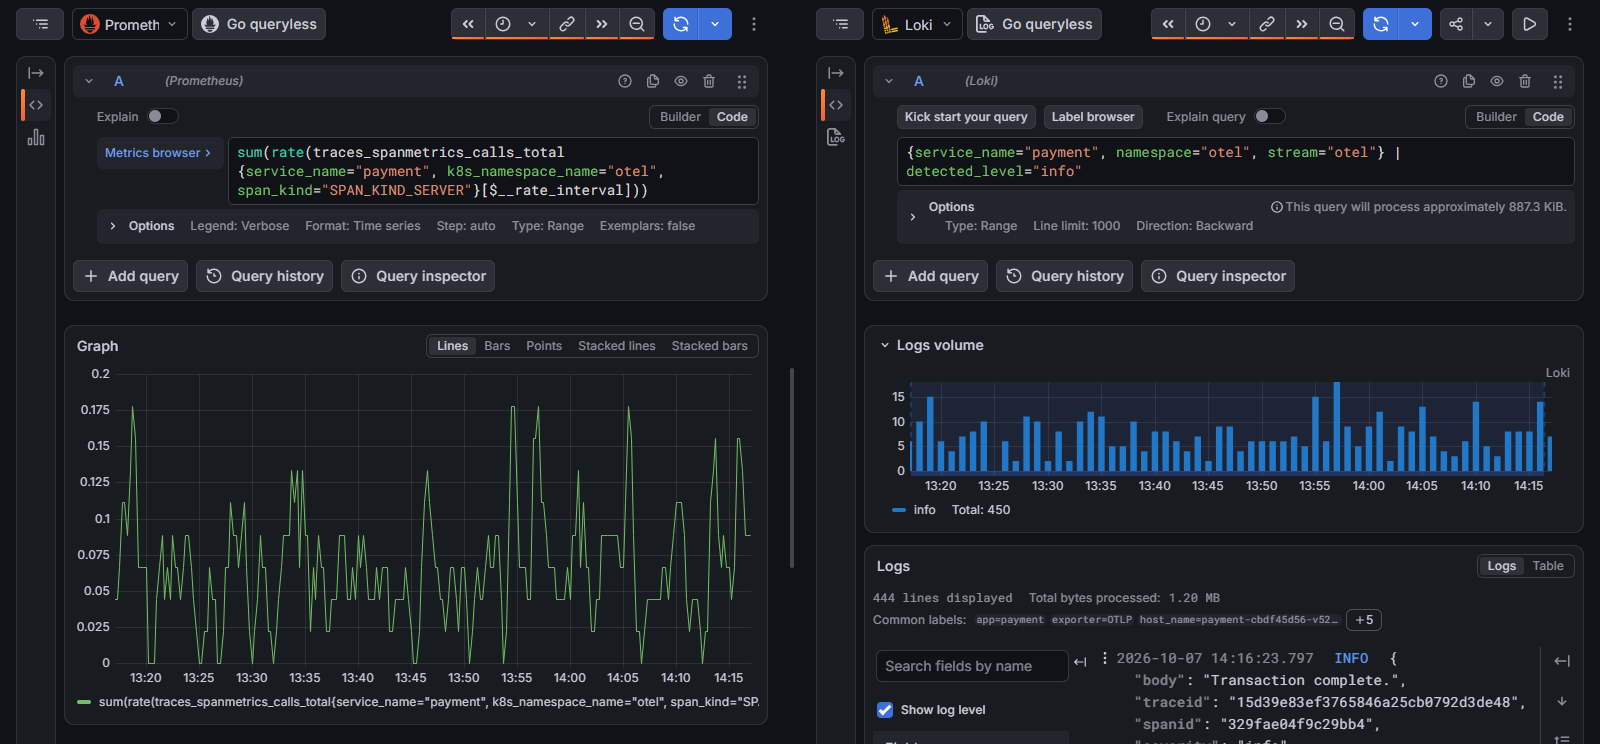
- Two independent panes — each has its own datasource, query, Go queryless and Query inspector.
- Synced times — chain icon in the time picker. An orange underline on the time buttons of both panes means the ranges are linked; the icon’s tooltip reads Unsync all views.
⋮menu — in a narrow pane it holds Close (closes the pane) and Add to dashboard. Share exists only in the right pane, because the link covers the whole view with both panes.
Access and configuration
- The
datasources:explorepermission (Organization roles). In OSS the Editor role (and Admin) has it. A Viewer gets Explore only through[users] viewers_can_edit = true, which is deprecated and also lets Viewers edit dashboards without saving. The workshop lab hasviewers_can_edit = trueand anonymous access with the Editor role, so Viewers and anonymous users have Explore there too. In production turn both off and grant Explore through the Editor role. -
[explore]ingrafana.ini:Key Default Effect enabledtruefalseremoves Explore from the menu and disables the/exploreroutedefaultTimeOffset1hdefault time picker range when entering Explore ( now-1h); a value that doesn’t parse as a duration (e.g.1 hour) stops Grafana from startinghide_logs_downloadfalsehides log download (txt / json / csv) in the Explore log list and Download logs in the inspector hide_logs_downloadis not DLP. It hides the log download buttons, but Query inspector → Data → Download CSV still works, and so does the/api/ds/queryAPI.
Query history
Documentation: Query history.
- Where: the Grafana database, per user. An entry is written on every query run.
- Retention: 2 weeks (not configurable) plus a global limit of 200,000 rows in
query_history— on a large instance history is shorter. Starred queries don’t expire by time but have a 150,000-row limit (query_history_star). [query_history] enabled = falsemoves history to the browser’slocalStorage(7 days by default, max 10,000 entries, retention set by the user): it leaves the database, but also no longer follows the user across devices.- This is data. Raw queries, including SQL with literals (customer numbers, e-mails), sit in the Grafana database. Account for that in backups and in database access.
- Saved queries (query library) are Enterprise / Cloud. OSS keeps stars in history.
The Explore URL as an interface
Documentation: Generate Explore URLs from external tools.
Explore state lives in the URL: /explore?schemaVersion=1&orgId=1&panes=<JSON>. panes is encoded JSON with one key per pane (a, b…), each holding datasource (uid), queries and range. A ticketing system, runbook or alert can build such a link without clicking. The full URL is long and chat tools truncate it, so manual sharing uses the short link /goto/<uid>.
Query inspector — the diagnostic tool
Documentation: Query inspector in Explore.
Query inspector in Explore (and Inspect in the panel menu) has these tabs:
| Tab | What it shows | What for |
|---|---|---|
| Stats | query time, row count | slow query or slow rendering |
| Query | request and response (Refresh re-sends the query) | intervalMs, maxDataPoints, executedQueryString with the actual Step |
| JSON | Panel data / DataFrame JSON (the panel inspector also has Panel JSON) | what reached the panel after transformations vs what came from the datasource |
| Data | data table, Download CSV; logs as TXT, traces as Jaeger / Zipkin / OTLP JSON | export for a ticket or a comparison |
| Error | the full query error | when the panel shows only an error icon |
The Query tab after Refresh for the query from the first screenshot (last hour, Explore at full width):

Expr— the query sent to Prometheus, after variable substitution:$__rate_intervalbecame[1m0s](4 × the default 15 s scrape interval).Step: 15s— the result step. An hour split into over a thousand points gives under 3 s, so Grafana raises the step to the datasource’s scrape interval.A: 241 rows— the number of points returned (one hour at 15 s plus one).- Expand all — expands the whole request and response.
intervalMsandmaxDataPointsare inrequest.data.queries[0].
Panel ≠ Explore
The same query with $__interval gives different values in a panel and in Explore:
- Max data points defaults to the graph width in pixels. A narrow panel has a few hundred points, full-width Explore over a thousand.
- Grafana computes
$__interval= range / max data points, rounded to a “nice” value (1m, 2m, 5m…) and not lower than the datasource’stimeInterval(Scrape interval). - A different
$__intervalmeans a differentrate()window, different maxima, different Stat values and different expression results. - Explore opened from the panel menu carries the queries with variables substituted (including
$__intervalwith the panel’s value), the range and the datasource. Therate()window then matches the panel; the step differs. A different window comes from a query with$__intervaltyped into Explore from scratch. Min interval, Max data points, transformations and expressions stay on the dashboard.
To stabilise: an explicit window in the query ([5m]) plus Min interval in the panel and Min step in Explore, or an organisation-wide floor through timeInterval in the datasource. $__rate_interval alone won’t align results, because Grafana derives it from $__interval.
💪Exercise💪 (self-guided): Split view, inspector and saving an exploration —
paymentmetric and logs in split view, measuring the panel’s and Explore’sintervalMsandStep, aligning them with Min interval / Min step, a LogQL query saved as a panel.💪Exercise💪 🤖 (self-guided): Split view, inspector and saving an exploration with an AI agent — queries, Explore links and the Logs panel through an agent; measuring the panel’s, Explore’s and the agent’s
Stepin Query inspector.
Related lessons
- Logs, traces and datasource links
- Prometheus overview — scrape interval and
rate()windows - LogQL