Logs, traces and datasource links
Jumping log → trace → metric → profile in one click is datasource configuration, not a feature that “just works”. Each link has its own key in
jsonData, and each fails silently: the link disappears or opens an empty graph. This lesson covers logs and traces in Explore and the mechanics of these links.
Logs in Explore
Documentation: Logs in Explore.
- Volume histogram. Every log query fires a second, metric query over the full time range (header
X-Query-Tags: Source=logvolhist). On long ranges it loads Loki more than the log-line query itself. The documentation recommends a proxy in front of Loki (e.g. nginx with a timeout) that recognises these queries by the header. - Levels. Level colour and filter come from the
levellabel or fromdetected_level, which Loki computes at write time (fromlevel,severityand similar fields). - Deduplication (exact / numbers / signature), Show context (lines before and after in the same stream), Live (tail), TXT / JSON / CSV download.
- Log details have a Fields section (labels, structured metadata, parsed fields) and Links — this is where derived fields land.
Two streams of the same service
In the lab the OTel demo services have two streams in Loki with the same service_name:
stream |
Path | Line format |
|---|---|---|
otel |
OTLP → Alloy → otelcol.exporter.loki with loki.format = json |
one JSON line: body, traceid, spanid, severity, attributes, resources |
stdout |
container console → Alloy DaemonSet | the same record printed over several lines, each line separate |
Without stream="otel" counts double, and derived fields, patterns and text filters hit two different formats at once.
Trace view
Documentation: Traces in Explore.
- Minimap and timeline, critical path, Span filters: in the trace header a Filters row (service, name, duration, attributes) and the Critical path, Errors, High latency toggles.
- The trace’s Node graph and the service graph (from the Tempo metrics-generator’s
service_graphsmetrics,serviceMap.datasourceUid). - Import trace — a JSON file (Jaeger / Zipkin / OTLP), e.g. exported from Query inspector on another instance.
- Span links (logs, metrics, profiles, correlations) are in the span details. With more than three links Grafana folds them into a Links menu.
The user_add_to_cart trace from the shop in the workshop lab, opened in Explore by trace ID (Tempo datasource):
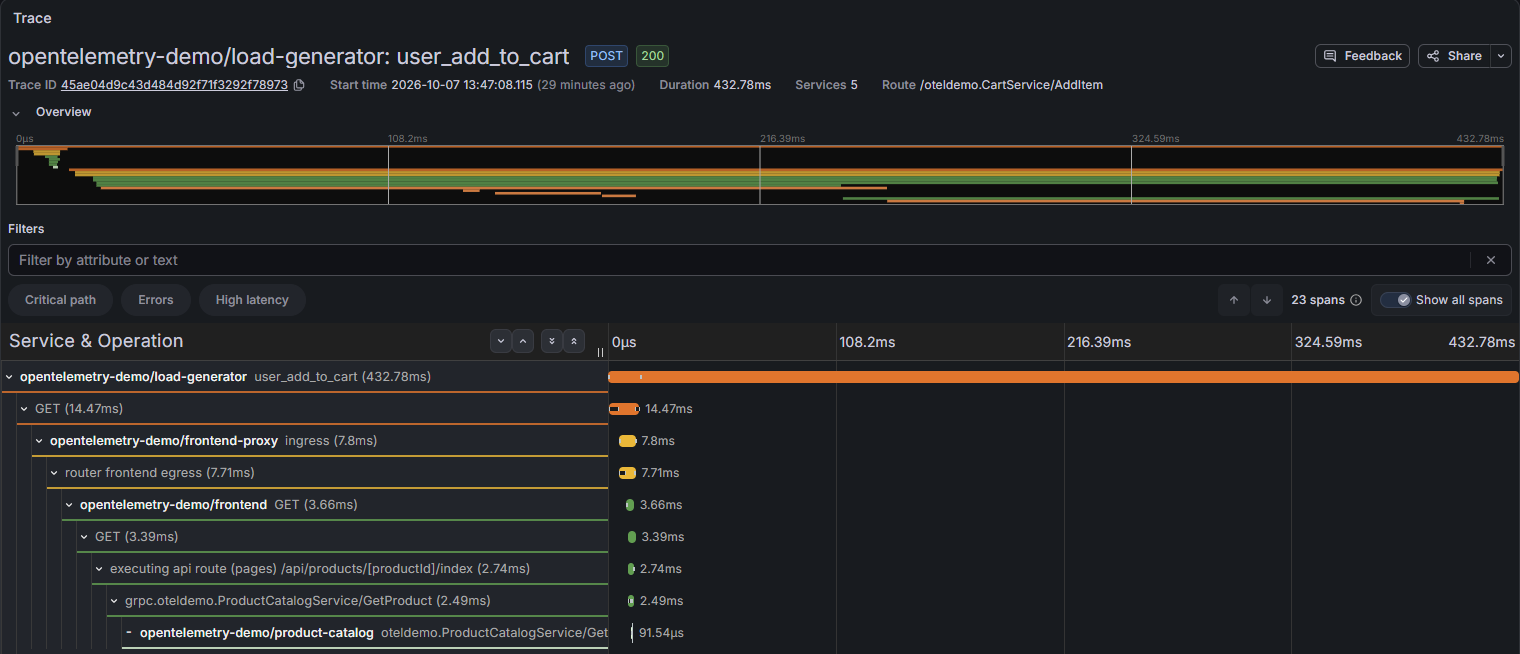
- Header — root span service and name, HTTP method and status, trace ID, start time, duration, number of services and the route.
- Overview — minimap of the whole trace. Selecting a fragment zooms the timeline below.
- Filters — a filter field for attributes and text, and the Critical path, Errors, High latency toggles. On the right, the span count and Show all spans.
- Service & Operation — the span tree: service in bold, then the span name and time. The bar colour is the service’s colour, not the span status.
Links between signals
%%{init: {"flowchart": {"curve": "basis", "nodeSpacing": 22, "rankSpacing": 80, "padding": 12}, "themeVariables": {"fontSize": "15px", "lineColor": "#8a93a3", "edgeLabelBackground": "#ffffff"}}}%%
flowchart LR
  L("<b>Loki</b><br/>logs") -->|derivedFields| T("<b>Tempo</b><br/>trace")
  T -->|tracesToLogsV2| L
  T -->|tracesToMetrics| P("<b>Prometheus</b><br/>metrics")
  T -->|tracesToProfiles| Y("<b>Pyroscope</b><br/>profiles")
  P -->|exemplarTraceIdDestinations| T

  classDef green fill:#e3f4ee,stroke:#0f9d76,stroke-width:2px,color:#1b1f27
  classDef blue fill:#e8f0fc,stroke:#2f6fde,stroke-width:2px,color:#1b1f27
  classDef orange fill:#fbefe3,stroke:#d9822b,stroke-width:2px,color:#1b1f27
  classDef purple fill:#f0eafe,stroke:#8b5cf6,stroke-width:2px,color:#1b1f27
  class L green
  class T blue
  class P orange
  class Y purple

  click L href "https://grafana.com/docs/grafana/latest/datasources/loki/configure/#derived-fields"
  click T href "https://grafana.com/docs/grafana/latest/datasources/tempo/configure-tempo-data-source/"
  click P href "https://grafana.com/docs/grafana/latest/datasources/prometheus/configure/#exemplars"
Derived fields (Loki → Tempo)
Documentation: Derived fields.
| Key | Meaning |
|---|---|
matcherType: regex |
regex on the line content, first group is the value |
matcherType: label |
regex on the name of a label, structured metadata or parsed field (\| json, \| logfmt) |
datasourceUid |
Tempo uid — internal link, opens the trace in split view |
url |
${__value.raw} for an internal link; in a provisioning file $${__value.raw} |
urlDisplayLabel |
link text in log details |
- One value per line and one derived field per rule.
- The documentation’s regex
traceID=(\w+)matches logfmt. An OTLP JSON line has"traceid":"<hex>"— different case and format, so the link disappears without an error. - A derived field belongs to the datasource: it works in Explore and in dashboard Logs panels. Correlations work only in Explore.
Tempo → logs, metrics, profiles
Documentation: Trace to logs, Trace to metrics, Trace to profiles.
All three turn tags into label="value" pairs from the span. Values come from resource and span attributes and from the pseudo-tags name, spanId, traceId, duration. They differ in what happens when nothing matches:
tracesToLogsV2 |
tracesToMetrics |
tracesToProfiles |
|
|---|---|---|---|
Default tags (when tags is empty) |
cluster, hostname, namespace, pod, service.name, service.namespace; dot → underscore only for these, your own tags you map explicitly via value |
the same set | service.name, service.namespace |
| No matching tag | no link | link exists, $__tags empty |
with customQuery the link always exists |
| Time range | span time + spanStartTimeShift / spanEndTimeShift |
span time + shifts (default ±2 min) | span time; ±60 s with the pyroscope.profile.id attribute; no shifts |
| Link label | Logs for this span / Logs for this trace / Related logs | queries[].name |
Profiles for this span and in Explore Open in Profiles Drilldown (span with pyroscope.profile.id); without that attribute Related profiles |
filterByTraceIDdoesn’t append|= "<traceId>". Grafana generates| label_format log_line_contains_trace_id=withcontains "<traceId>" __line__, then| log_line_contains_trace_id="true" or trace_id="<traceId>". It works for a trace ID in the line content and in atrace_idlabel.filterBySpanIDdoes the same for the span ID.customQueryreplaces the generated query with your own, using${__span.traceId},${__span.spanId},${__span.tags["service.name"]},$__tags.datasourceUidis a uid. A datasource name works too, because Grafana looks up by uid, then by name — until the first rename.tracesToLogs(withoutV2) is ignored whentracesToLogsV2exists.tracesToProfileshas oneprofileTypeIdfor all services. A service whose SDK doesn’t collect that type (Node.js withoutprocess_cpu) gets an empty flame graph. Span profiles (filtered by span ID) work only for spans withpyroscope.profile.id; a short span waiting on the network usually has 0 CPU samples. On a span without that attribute the Related profiles link carries the unexpanded macro${__span.tags["pyroscope.profile.id"]}and Pyroscope answers with the errorinvalid span id length.
Details of the HGET span of the cart service from the same trace, with the Links menu expanded:
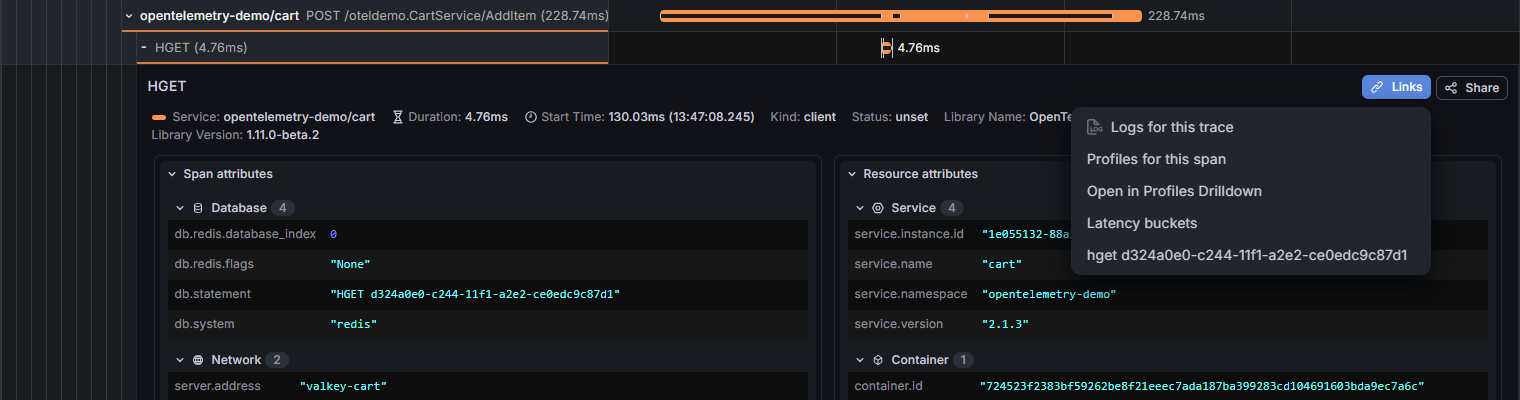
- Logs for this trace —
tracesToLogsV2. The lab hasfilterByTraceID: truewithoutfilterBySpanID, hence “trace”, not “span”. - Profiles for this span and Open in Profiles Drilldown —
tracesToProfiles. These labels appear because the span has thepyroscope.profile.idattribute; without it there would be Related profiles. - Latency buckets —
tracesToMetrics. The link text isqueries[].namefrom the datasource configuration. - hget d324a0e0-… — a correlation, not a datasource link. Five items is more than three, so Grafana collected them in the Links menu.
- Span attributes and Resource attributes — the attributes the links take
tagsvalues from (service.name,service.namespace,db.statement…).
Exemplars (Prometheus → Tempo)
- Grafana (Exemplars):
exemplarTraceIdDestinations: [{name: traceID, datasourceUid: tempo}].nameis the exemplar’s label name (the Tempo metrics-generator writestraceID), not the link text. - Backend: Prometheus stores exemplars only with
--enable-feature=exemplar-storage. Remote write forwards them only withsendExemplars: true. Mimir accepts them whenmax_global_exemplars_per_user> 0 (default 0). - In Explore: Options → Exemplars. On a dashboard panel: the Exemplars toggle in the query options.
- An exemplar points to a trace that was stored. A derived field from a log points to any trace ID, including one dropped by sampling — then “trace not found”.
Silent failures — how to recognise them
| Symptom | Cause | Check |
|---|---|---|
| no link in log details | the regex doesn’t match the line format | compare matcherRegex with the raw line |
| no logs link on a span | none of the tags in tags exists on the span |
span attributes vs tracesToLogsV2.tags[].key |
| metrics link, empty graph | the label from tags[].value doesn’t exist in the metric |
group by (...) on the metric from the query |
profiles link, 0 samples |
profile type missing, or range = time of a short span | Drilldown → Profiles, the service’s profile types |
| exemplar points without a link | no exemplarTraceIdDestinations or wrong name |
exemplar labels in the tooltip |
| no exemplar points | the backend doesn’t store them | Prometheus flags, sendExemplars, Mimir limit |
💪Exercise💪 (self-guided): Audit of links between signals — five links in the workshop lab, the cause of each failure pinned to a configuration key.
💪Exercise💪 🤖 (self-guided): Audit of links between signals with an AI agent — the agent checks the link configuration against the data through Grafana MCP and predicts the generated queries; you verify each prediction with a click in Explore.
💪Exercise💪 (self-guided): Links between signals in datasource configuration — the audit’s fixes applied to your own datasource copies through the API, two silent failures triggered on purpose, comparison with the provisioning file.
Related lessons
- Explore
- Drilldown apps
- Integrations & TraceQL — the Tempo side of trace-to-logs/metrics/profiles
- Exemplars — how exemplars are produced
- Flame graphs